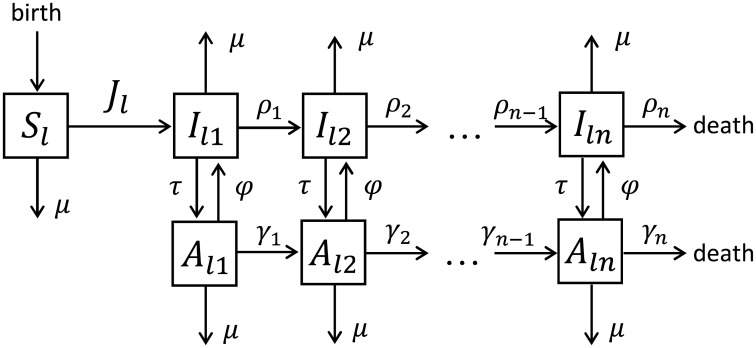
Fig 1. Schematic diagram of the HIV model.
The model describes HIV infection process, disease progression through n stages of infection, birth, background mortality and HIV related mortality, the uptake of and dropping out of ART. The model assumes that the population is divided into the classes of susceptibles, Sl(t), infected, Ilk(t), and treated, Alk(t), in n stages of infection, k = 1, …, n. The population is stratified into m risk groups indicated by the label l = 1, …, m in the subscript, and the diagram describes the dynamics in one of them. The risk groups differ only in their partner change rates and initial group sizes, whilst the disease progression and dropping out of treatment are the same for all risk groups. The diagram shows the situation when treatment uptake is the same by all risk groups. We denote τl the uptake by risk group l when we consider heterogeneous ART uptake by risk group. The interaction between the groups is encoded in the time-dependent force of infection Jl(t) that takes into account mixing between the risk groups.

