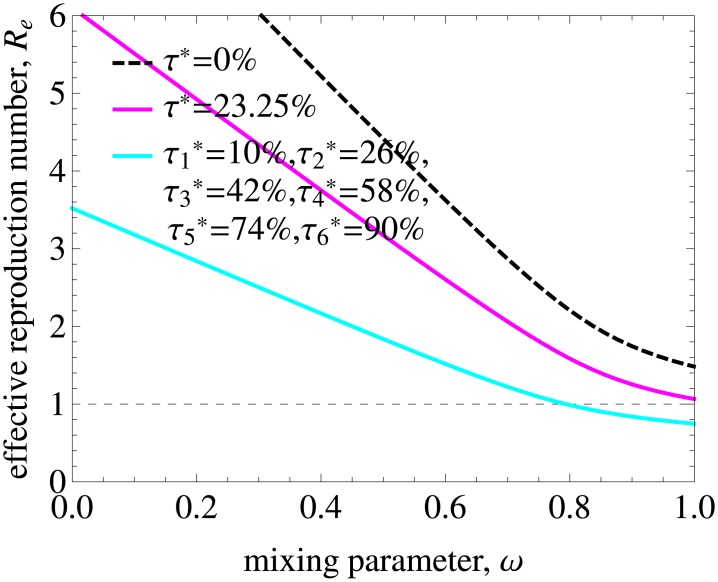
Fig 8. Effective reproduction number for heterogeneous uptake of testing and treatment.
denotes the uptake by risk group l. We considered progressively higher uptake rates by groups with higher numbers of partners. Specifically, we assumed that (lowest risk group), (highest risk group), and uptakes by the remaining 4 groups were equally spaced and increasing from 26% to 74%. The dashed line is R0 before ART. Also shown is Re for a constant treatment uptake rate of 23.25% computed as an average of uptakes by different groups weighted by their population size, . Heterogeneous test-and-treat with increasing treatment uptakes by higher risk groups has a larger impact on Re than homogeneous test-and-treat with a constant average uptake. See also S7 Fig with results for other combinations of treatment uptakes by different risk groups.

