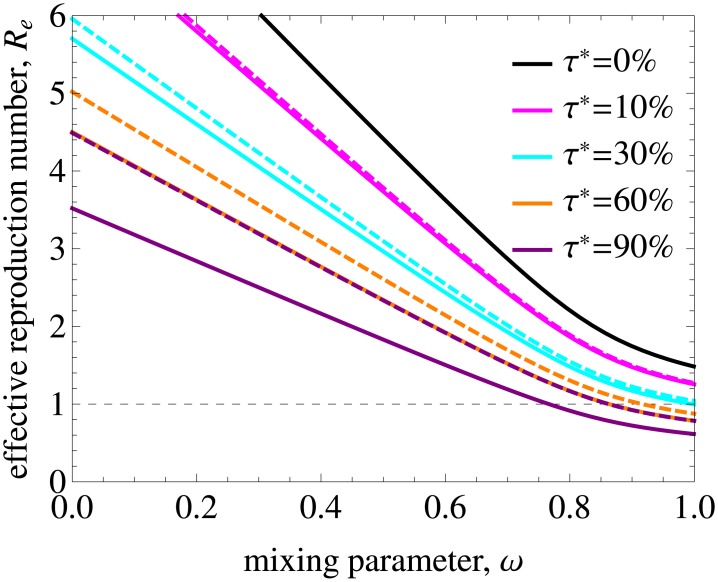
Fig 10. Effective reproduction number as a function of mixing and treatment uptake with and without uptake during the primary infection.
The solid lines are repeated from Fig 6A and correspond to the annual treatment uptake percentage, τ*. The dashed lines were obtained when treatment uptake during the primary infection was set to 0 for all risk groups. As expected, elimination is more difficult to achieve in this case and the impact of not treating primary infection increases with increasing treatment uptake.

