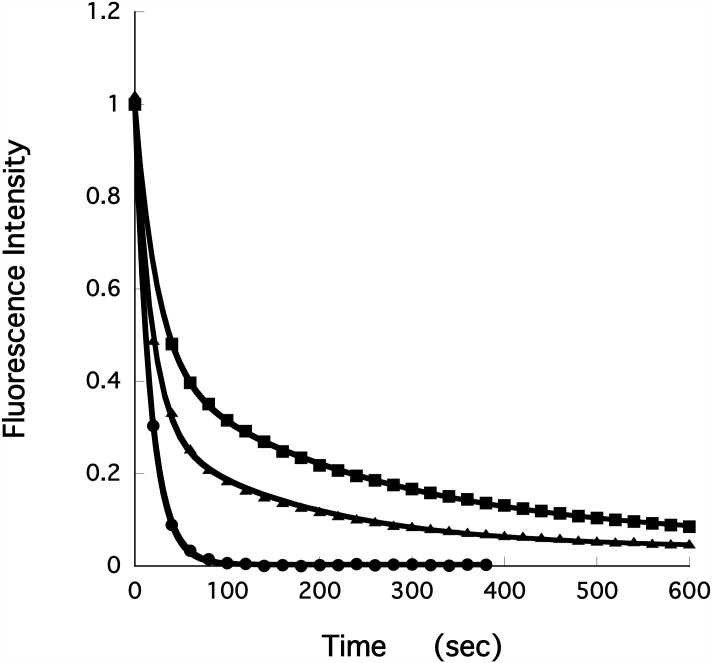
Fig 4. The intensity of the fiber fluorescence, relative to the pre-chase value, is plotted as a function of time during the chase phase of the single nucleotide turnover measurements.
The fibers were previously relaxed in 250μM mantATP, and then chased with 4mM ATP. Fiber fluorescence decreases in two phases, a fast phase that is largely over in about 20–30 seconds, followed by a slow phase with a lifetime of minutes. The slow phase arises from the slow release of nucleotides by myosin in the SRX. The top trace (solid squares) shows a control fiber. The middle trace (solid triangles) shows a fiber exchanged with RLC-C6 labeled with MDCC. As shown the slower phase has a decreased population and a faster lifetime, indicating that the SRX has been partially destabilized. The lowest trace (solid circles) shows a fiber exchanged with RLC-C44 labeled with BIMANE. Here the slow phase is completely absent, indicating complete destabilization of the SRX.

