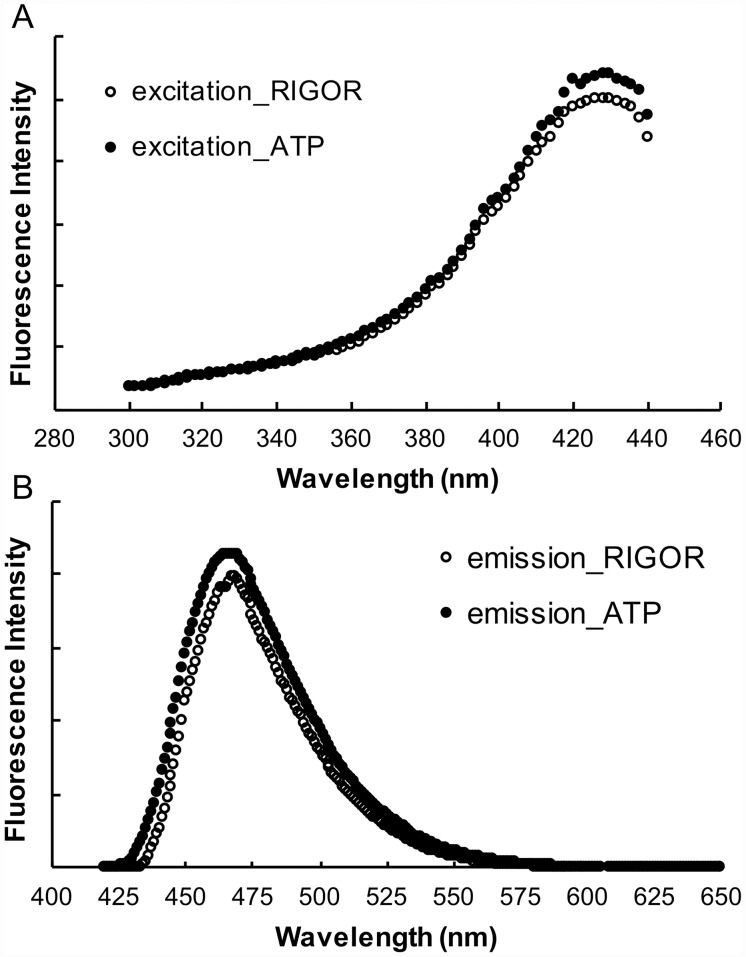
Fig 8. Excitation (panel A) and emission (panel B) spectra of RLC–C5–MDCC exchanged into fibers.
Fibers were mounted in a fluorescence cuvette as described in Methods and observed first in a rigor solution followed by a relaxing solution. Intensities are shown in arbitrary units. For excitation spectra the emission was observed at 525nm, and for emission spectra the fibers were excited at 387nm. As can be seen there was a shift in the emission spectrum to shorter wavelengths in the relaxing solution. There was also an increase in absolute intensity, whose magnitude was determined by quantitative epi-fluorescence microscopy as described in Methods. There was no change in the shape of the excitation spectrum.

