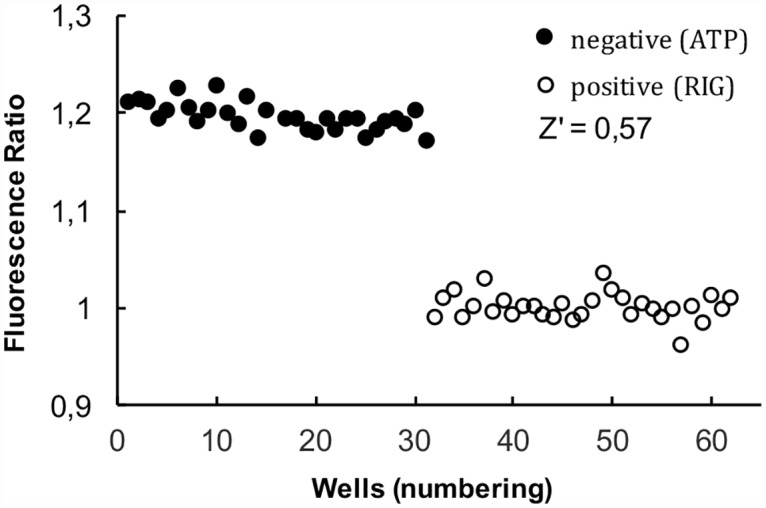
Fig 9. Measuring the SRX in a plate reader.

Fibers labeled with C5-MDCC were minced and pipetted into wells of a 384 well plate. Images were obtained using quantitative epifluorescence at both short and long emission wavelengths. Images were analyzed to determine fiber fluorescence and the ratio of intensities is shown. The first 32 wells show data obtained in the presence of ATP. The average ratio is 1.195 ± 0.014 (st dev), characteristic of the SRX. The next 32 wells show data obtained in rigor, where the ratio is normalized to 1.0 ± 0.013 (st dev). The Z’ factor calculated from the data was 0.57 indicating that a more extensive screen using these methods is realistic.
