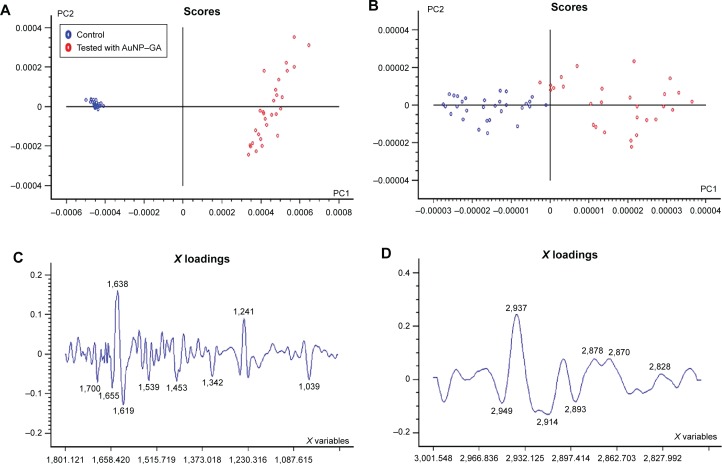
Figure 5.
FTIR spectral analysis at wave number region of (A and C) 1,800–1,000 cm−1 and (B and D) 3,000–2,827 cm−1 by PCA using control and tested cells with AuNP–GA in P. shigelloides.
Abbreviations: FTIR, Fourier transform infrared; PCA, principal component analysis; AuNP, gold nanoparticles; GA, gallic acid; P. shigelloides, Plesiomonas shigelloides; PC1, principal component 1; PC2, principal component 2.

