
Figure 2.
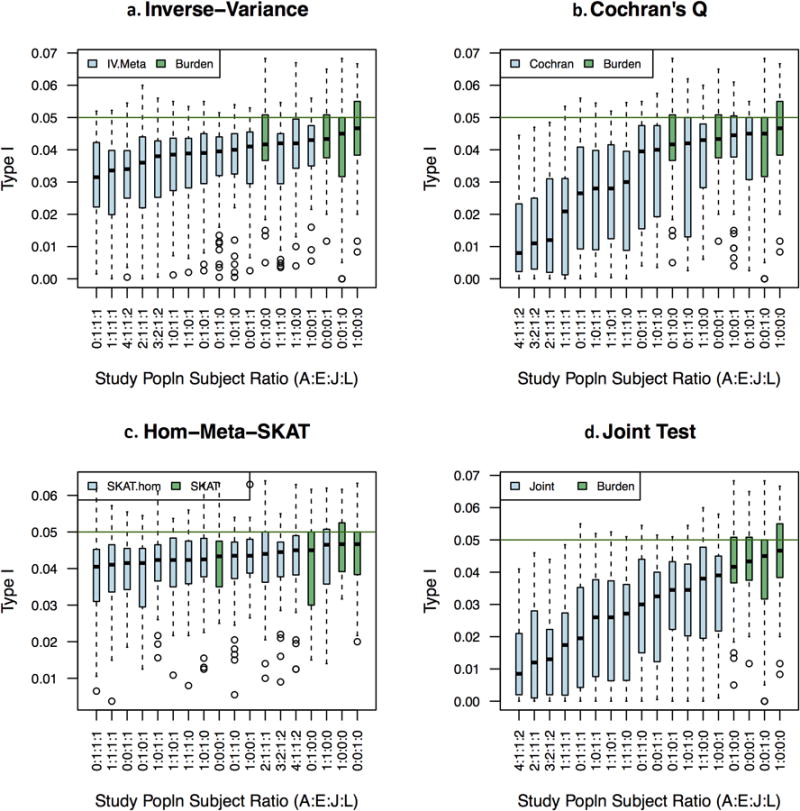
Type I error (at nominal 5% alpha) for individual ethnic results and several sampling fractions Panels a-d each contain vertical box-plots of gene Type I error (false positive) rates for indicated metaanalysis statistic. Green horizontal line is placed at the nominal type I error rate of alpha=0.05. The X-axis lists study populations as a ratio of African American, European American, Japanese American, and Latina subjects. Box plots are arranged from left to right by increasing median Type I error rate for fourteen multiethnic and four mono-ethnic study populations. Green box plots are burden (panels a,b, and d) or SKAT tests (panel c) in a mono-ethnic population.