
Figure 4.
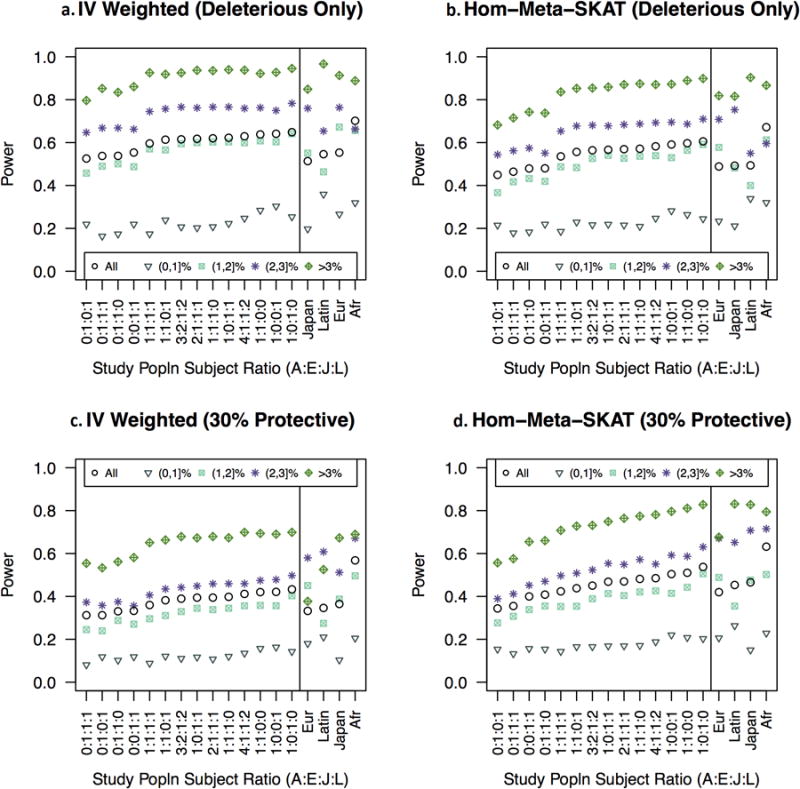
In panels a and b, all causal variants are deleterious. In lower panels, a portion of causal variants are protective. Panels a and c display burden tests and meta-analysis of burden tests. Panels b and d display MetaSKAT and SKAT tests. Within each panel, left field shows statistical power for all genes by CP and by overall CP for fourteen multi-ethnic populations. Study populations are ordered by increasing mean power for all genes from left to right. In the far right field of each panel, four ethnicities are arranged from left to right by mean power for all genes. Mean power is shown for genes in each category of ethnic-specific CP for the indicated ethnicity. Legend: Overall CP was estimated in a population of 4,611 women as the proportion of women carrying at least one rare variant. Ethnicity specific CP was estimated in each ethnicity as the proportion of women of that ethnicity who carry at least one rare variant.