
Figure 5.
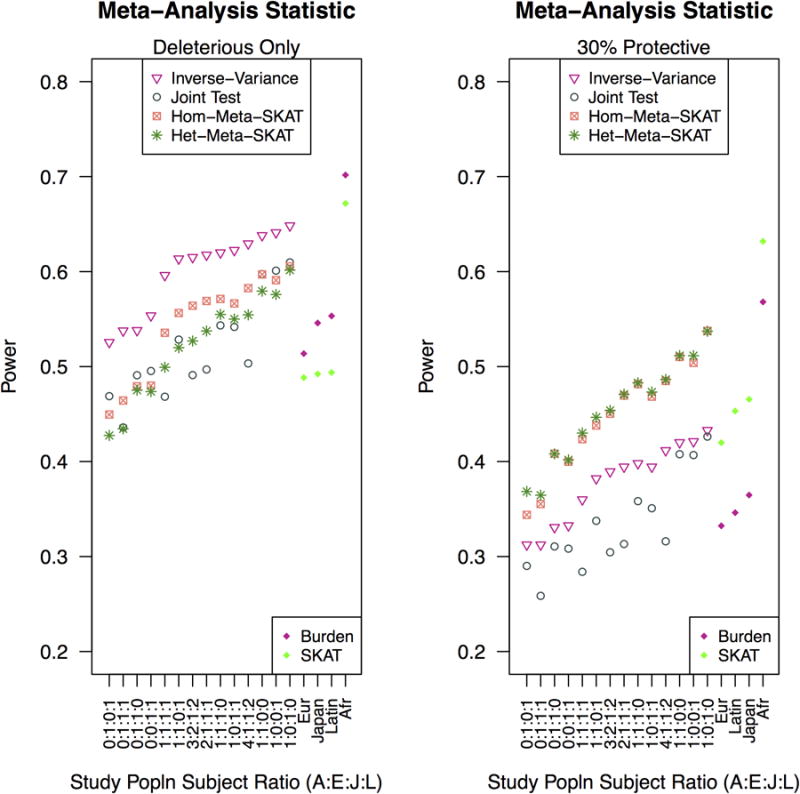
Both penetrance models use a RR of 2.5. In the left panel, all causal variants are deleterious and in the right panel, a portion of causal variants are protective. Multiethnic study populations are arranged in the same order for both left and right panels and power for inverse-variance meta-analysis of burden tests increases for all deleterious causal variants increases from left to right. Again, X-axis depicts multiethnic study populations as the ratio of African American, European American, Japanese American and Latina subjects. Not shown: power for Cochran's Q was under 0.2 for all scenarios depicted.