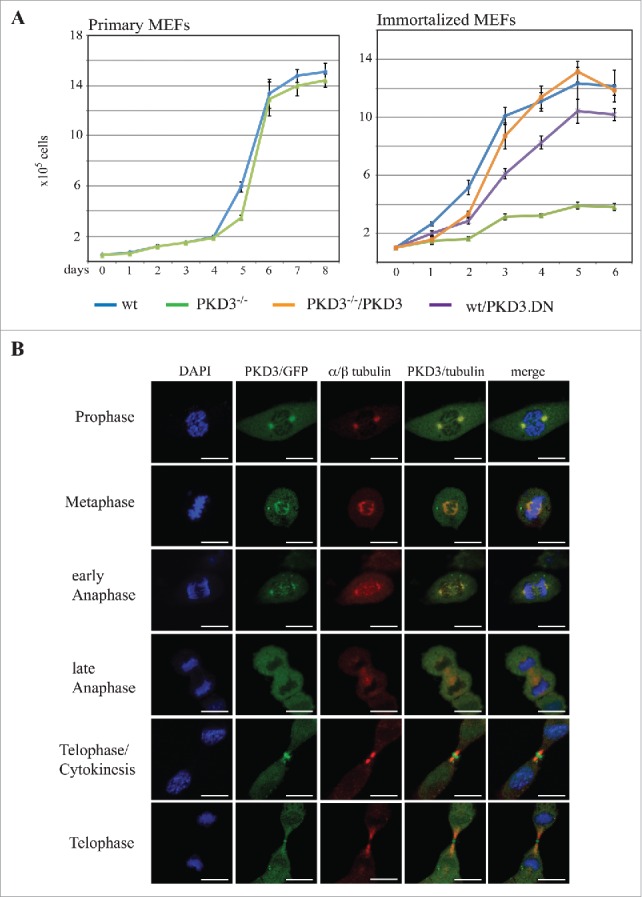
Figure 1.

Proliferation alteration mediated by PKD3 deficiency and its sub cellular localization during mitosis: (A) MEFs were seeded out at day 0 and cell numbers were counted each day for 6–8 days after seeding. Left graph indicates proliferation rates of primary wild type (blue) and PKD3 deficient (green) MEFs. Right graph indicates proliferation rates of immortalized wild type (blue), PKD3 deficient (green), wild type + exogenously expressing PKD.DN construct (purple) and PKD3 deficient + exogenously expressing PKD3 construct (orange) MEFs. PKD3 deficiency and expression of exogenous expressed proteins was verified by western blotting (data not shown). Quantitative results (means +/− SD of triplicates) are shown. (B) PKD3/GFP localization during mitosis was analyzed by immunofluorescence. Individual stages of mitosis (indicated on the left) were estimated by DAPI staining (1st column). 2nd column shows the corresponding PKD3/GFP signal followed by α/β tubulin antibody staining for verification of mitotic structures. Merge of the PKD3/GFP and α/β tubulin signal and a complete merge are shown in the last two columns. Expression of the PKD3/GFP construct was verified by protein gel blot (data not shown), all images are representative for each stage and applied staining. Scale bars: 48 μM.
