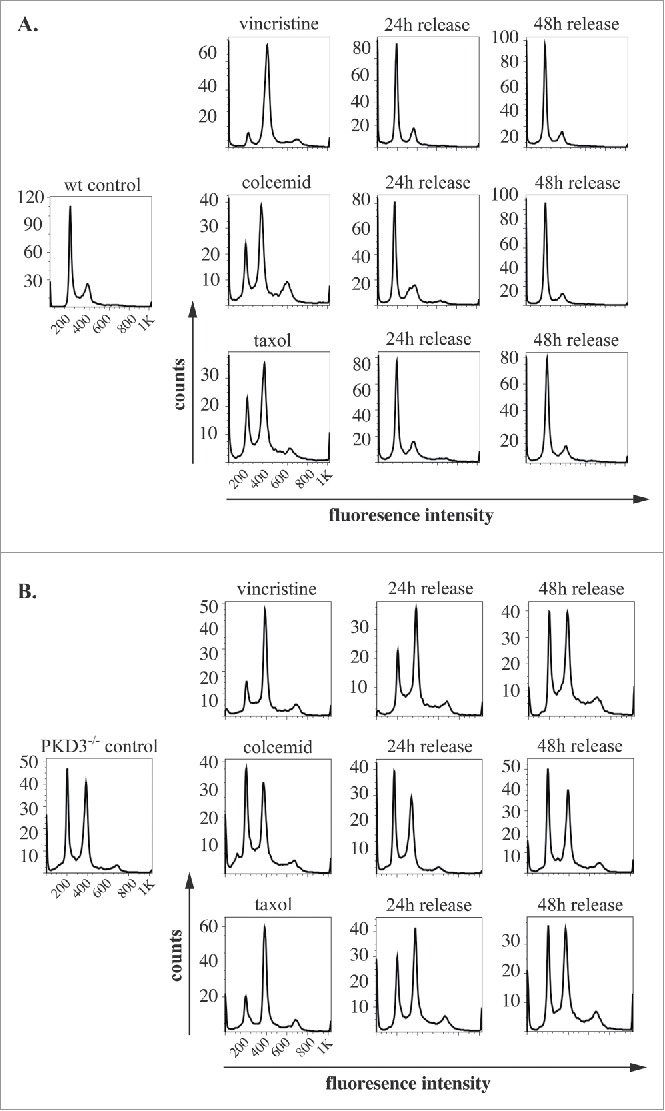
Figure 3.

PKD3 deficiency induces alterations in microtubule dynamics after synchronization: Wild type and PKD3 deficient MEFs were starved for 24 h and treated with indicated inhibitors for another 24 h before release. PI stainings were performed for individual time points as indicated. (A) Wild type samples are shown. Single left graph indicates wt control before treatment followed by vincristine (top), colcemid (middle) and taxol (bottom) treated samples after starvation but before release, followed by graphs showing PI stainings after 24 h and 48 h release. (B) PKD3 deficient samples are shown. Single left graph indicates PKD3 deficient control before treatment followed by vincristine (top), colcemid (middle) and taxol (bottom) treated samples after starvation but before release, followed by graphs showing PI stainings after 24 h and 48 h release. For all assays, multiple independent experiments were performed which all showed similar results.
