Figure 2.

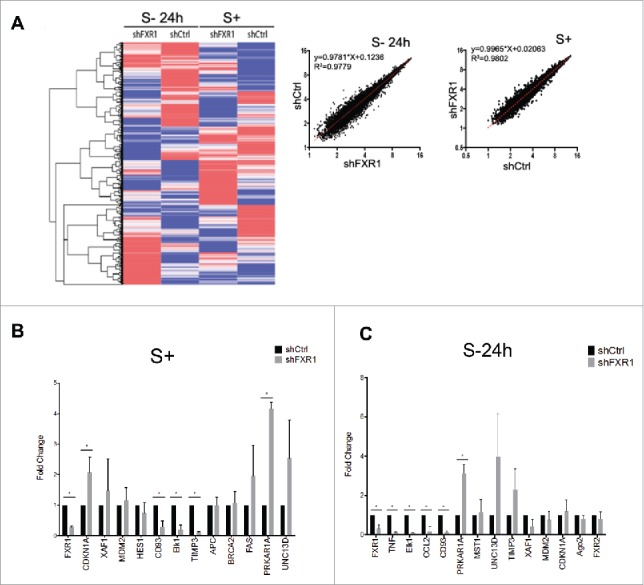
Global gene expression profiling of FXR1 regulated mRNAs by microarray analysis in control and FXR1 knockdown THP1 monocytes. (A) (Left) Heatmap analysis of microarray data (Table S1) from THP1 control (shCtrl) and FXR1 knockdown (shFXR1) cells grown in serum containing media (S+) or serum-starved for 24 h (S-24 h). Heatmap representation and clustering (Euclidean) was done using GENE-E software. (Right) The logarithmic value of individual RNAs in FXR1 knockdown cells (shFXR1) was plotted against those values in control cells (shCtrl), grown in serum containing media (S+) or serum-starved for 24 h (S-24 h). R square and curve equations were calculated using linear regression model with prism6. (B-C) Fold change values from qRT-PCR of a subset of targets identified from the microarray from serum grown (S+) and serum-starvation (S- 24h) conditions (Tables S2A-B). The data plotted are the mean and SD of 4 biological replicates. Statistical significance was determined with t test comparison using the Holm-Sidak method.
