
Figure 3.
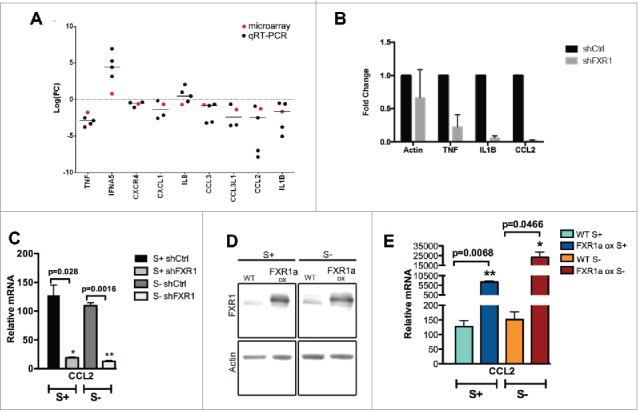
Immune response genes, including cytokines and chemokines, are regulated by FXR1. (A) Gene Ontology (GO) analysis for differentially expressed genes was performed using the DAVID tool, as previously conducted.33 Immune response associated genes in serum-starved cells (S-24 h) are observed to be significantly affected by FXR1 depletion (Fig. S2, Tables S2B, S3). Analysis of RNA expression for a subset of mRNAs related to immune response in serum-starved FXR1 depleted cells compared to serum-starved shCtrl cells: the log base 2 of the fold change values for qRT-PCR (black dot) and microarray (red dot) are plotted. (B) qRT-PCR analysis of select cytokine and chemokine mRNAs in serum-starved cells showing the fold decrease upon FXR1 knockdown. (C) qRT-PCR analysis of CCL2 mRNA normalized to tRNA-lys RNA levels in control (shCtrl) and FXR1 knockdown (shFXR1) cells grown in serum (S+) and 24 h serum-starvation (S-) conditions. The average of 3 technical replicates is shown with SEM as error bars. p-values were calculated by 2-tailed paired t-test. (D) Western blot analysis of FXR1 in THP1 stable cell lines without (WT) or with FXR1a constitutive overexpression (FXR1a ox), grown in serum (S+) and 24 h serum-starvation (S- 24 h) conditions. (E) qRT-PCR analysis of CCL2 mRNA normalized to tRNA-lys RNA levels in control (WT) and FXR1 overexpression (FXR1a ox) cells grown in serum (S+) and 24 h serum-starvation (S-) conditions. The average of 3 technical replicates is shown with SEM as error bars. p-values were calculated by 2-tailed paired t-test.