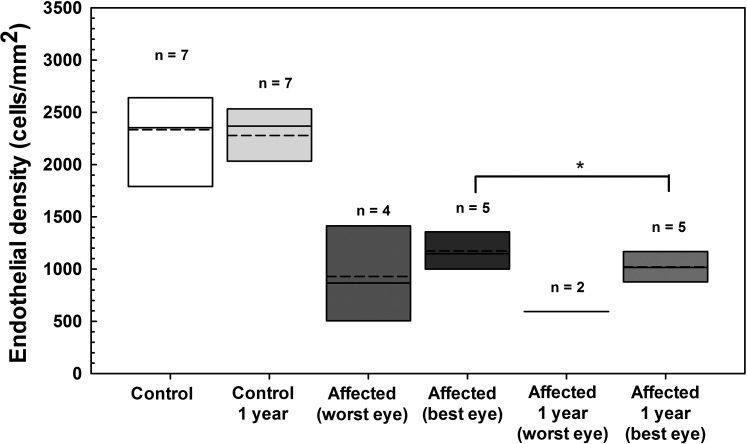
Figure 7.
Endothelial density significantly decreased in the less affected eye of BTs with CED but did not change in control BTs (data averaged for both eyes) over approximately 1 year as measured by IVCM. Endothelial density did not significantly differ (P = 0.63) over 10.2 ± 1.2 months in seven unaffected dogs. Mean ± SD endothelial density significantly decreased (P = 0.043) in the less affected eye of five dogs with CED from 1172 ± 245 cells/mm2 at baseline to 1020 ± 161 cells/mm2 at 11.8 ± 1.2 months. Endothelial cell density could not be assessed in three eyes of two dogs and five eyes of four dogs with CED due to severe corneal edema at the onset of the study and at 11.8 ± 1.6 months, respectively. Box plots depict median (solid line), mean (dashed line), and 25th and 75th percentiles. The P values were determined by a paired t-test for each group between the time points. *P < 0.05.

