
Figure 3.
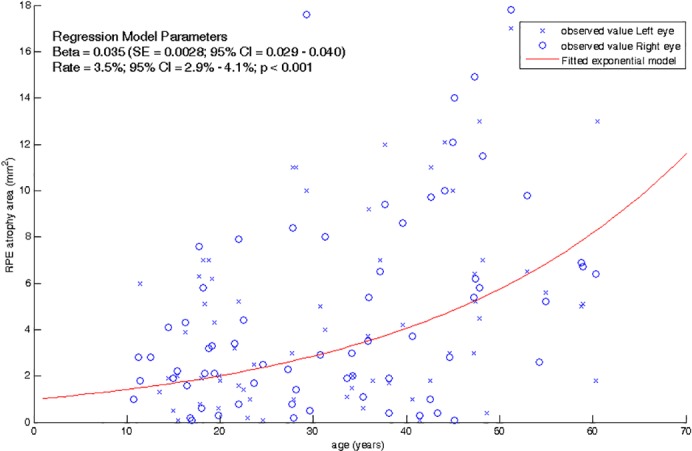
Macular RPE atrophy area in function of age in STGD1 patients. Red continuous line represents the exponential model fitted with repeated measurement regression by Generalized Estimating Equation.
Official websites use .gov
A
.gov website belongs to an official
government organization in the United States.
Secure .gov websites use HTTPS
A lock (
) or https:// means you've safely
connected to the .gov website. Share sensitive
information only on official, secure websites.
Macular RPE atrophy area in function of age in STGD1 patients. Red continuous line represents the exponential model fitted with repeated measurement regression by Generalized Estimating Equation.