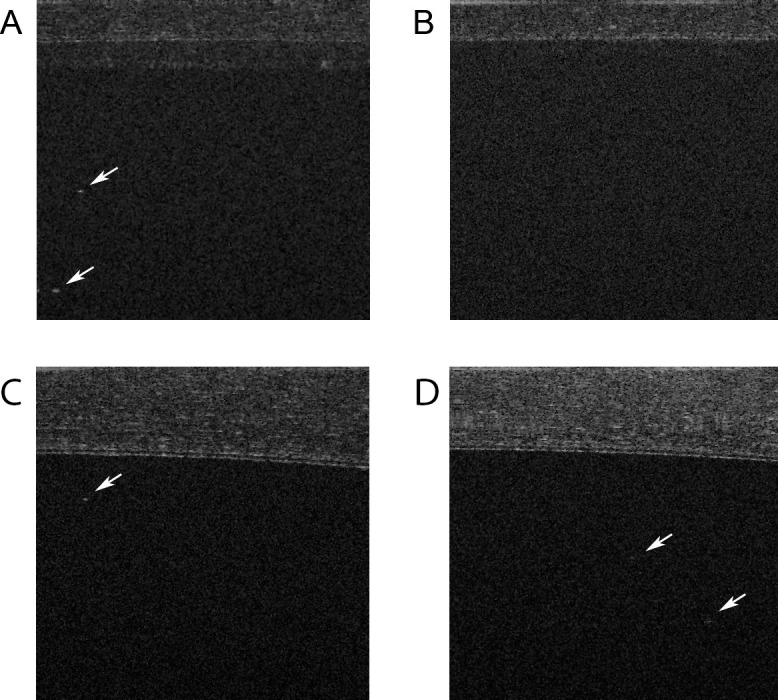
Figure 1.

Examples of SD-OCT B-scan image in an inflamed eye (A), control eye (B), and inflamed eyes with thickened corneas (C, D). The arrows point to hyperreflective specks representing cells. The signal toward the top of the image is the cornea. The thick cornea (C, D) attenuates the cell signal compared with A. The signal attenuation is greatest with increasing depth of penetration (D).
