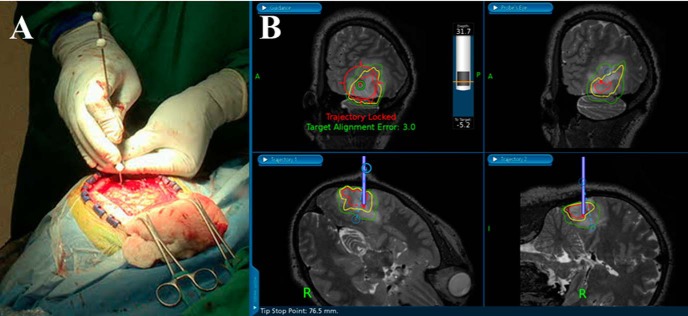
Figure 1.
Real-time tracking of a biopsy needle-cut window in image space using a neuronavigation station and needle with reflective fiducials (A). The surgeon can plan a trajectory that takes the biopsy needle into regions with metabolic abnormalities marked by color contours. The green, yellow, and red contours on the image represent regions where the Cho/NAA ratio is 2-, 5-, and 10-fold above values from contralateral normal-appearing white matter (NAWM) (B). The depth of the cutting window and its distance from the target can also be visualized in the top left panel of the neuronavigation display.

