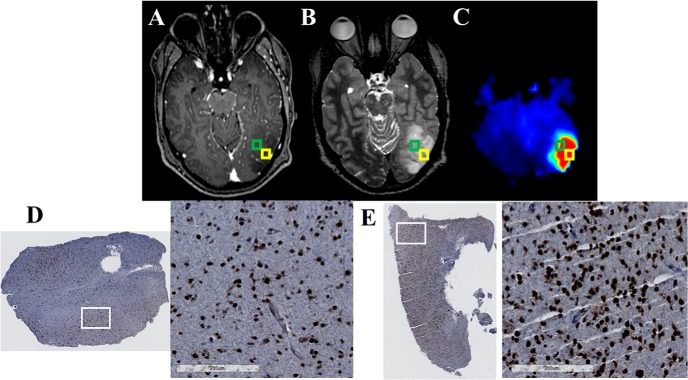
Figure 5.
The Cho/NAA map identifies regions of elevated SOX2 expression in a region of T2w hyperintensity in a 34-year-old patient (patient 2 in Supplemental Table 1) with a new anaplastic astrocytoma (A–C). The sMRI maps show that Cho/NAA is elevated in the posterior and lateral aspects of the T2w hyperintense region. However, no contrast enhancement is present. All tissue specimens sampled from Cho/NAA abnormalities in this patient exhibited elevations in SOX2 density and nuclear atypia. The tissue sampled from the region outlined with the green ROI exhibited a lower SOX2 density (0.019 mm2 SOX2/mm2 tissue, D) than the tissue sampled from an adjacent area (yellow ROI) with a higher Cho/NAA abnormality (0.042 mm2 SOX2/mm2 tissue, E). This patient has yet to exhibit recurrent disease.

