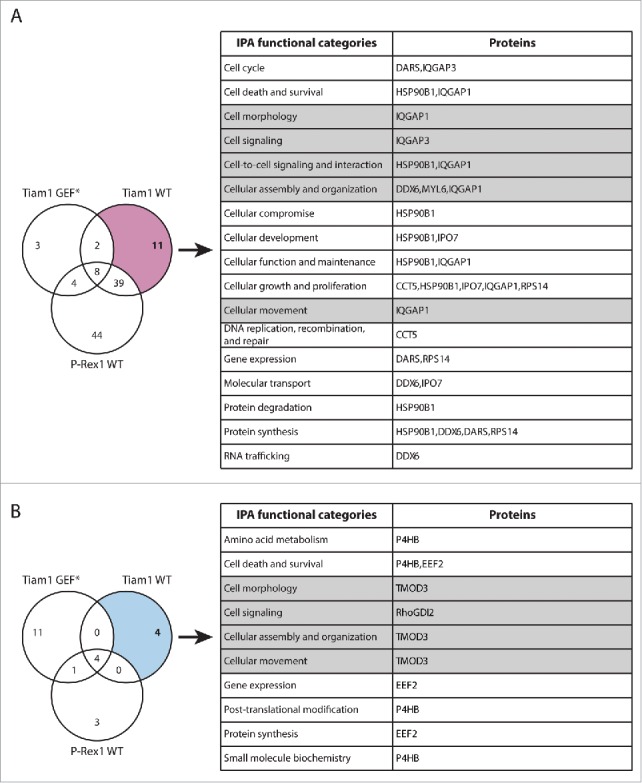
Figure 3.

Functional classification of proteins with Tiam1 WT-specific changes in Rac1 binding. (A) Venn diagram comparing proteins with increased Rac1 binding in ≥ 2 SILAC SF-TAP experiments upon expression of indicated GEF constructs. Tiam1 Wild Type (WT)-specific proteins are outlined. (B) Venn diagram comparing proteins with decreased Rac1 binding in ≥ 2 SILAC SF-TAP experiments upon expression of indicated GEF constructs. Tiam1 WT-specific proteins are outlined. For A and B the associated tables show clustering of the Tiam1 WT-specific proteins with increased or decreased Rac1 binding, respectively, according to their cellular functions based on Ingenuity Integrated Pathway Analysis (IPA). Full protein names and SILAC ratios are outlined in Supplementary File 1. Proteins in highlighted categories were presented as part of a heat map in our recent publication. 18
