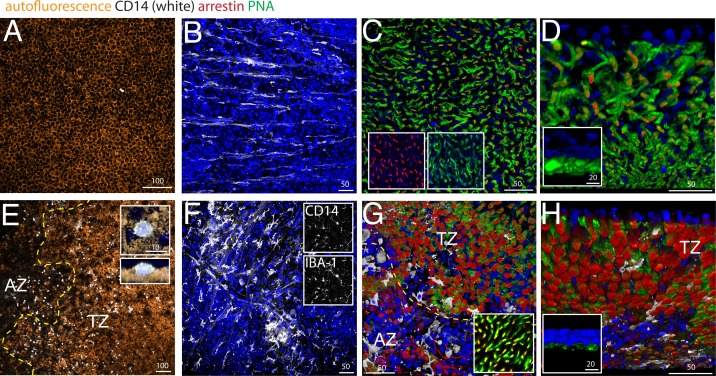
Figure 2. CD14, peanut agglutinin and cone arrestin staining on central flatmount preparations from control and geographic atrophy patients.
Representative micrographs of immunohistochemical detection (confocal Z stack projections) of CD14 (white), cone arrestin (red), peanut agglutinin (PNA,green), and Hoechst nuclear stain (blue, RPE autofluorescence visible in orange) of RPE/choroid- (A and E) and retinal- flatmounts (B–D and F–H) of a control donor (A–D) and a donor with geographic atrophy (GA, panel E–H). (E) 3D reconstruction at higher magnification of a CD14+cell on RPE flatmounts in an orthogonal (E, upper inset) and perpendicular (E, lower inset). (F) Representative confocal micrographs of CD14 (F, upper inset) -IBA-1 (F, lower inset) double labeling. (D and H) Oblique and perpendicular (insets) 3D reconstruction views of the outer aspect of the retinal flatmounts. The margin of the atrophic zone (AZ), recognized by the loss of RPE (E) and by the irregular cone distribution and a thinned outer nuclear layer (G) is indicated by the yellow dotted line. (G) PNA/arrestin pattern distant (>1000 μm) from the AZ of a patient with GA (G inset). Experiments on flatmounts from 4 different control and patients with GA gave similar results. AZ : atrophic zone; TZ : transitional zone. Scale bars A and E = 100 μm; B–C and F–G = 50 μm; inset D and H = 20 μm.

