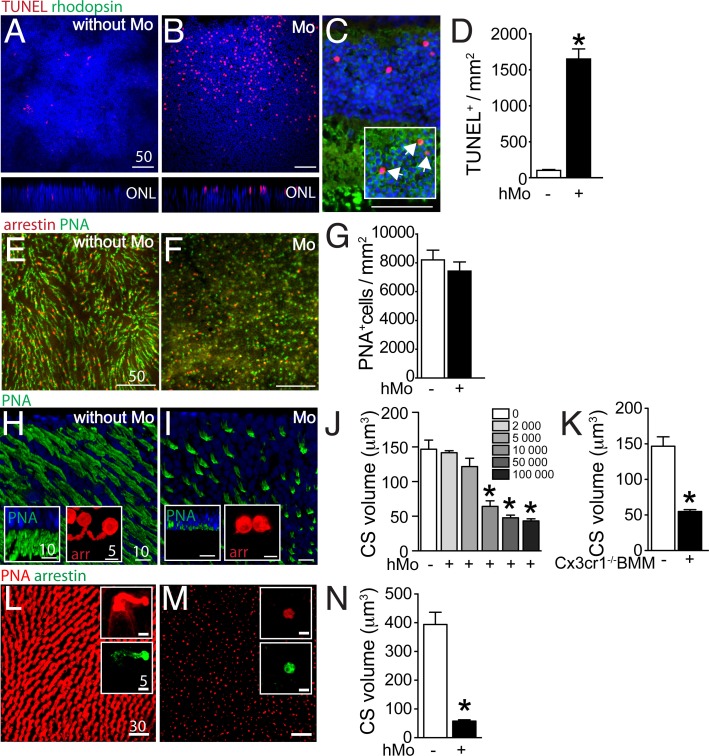
Figure 3. Evaluation of rods and cones in monocyte/retinal explant co-cultures.
(A and B) Orthogonal projection of confocal Z stack images of the outer nuclear layer of TUNEL- (red), Hoechst nuclear dye- (blue) stained mouse retinal explants after 18 hr of culture (A) or co-culture with human monocytes (hMo, panel B). (C) TUNEL(red)/rhodopsin(green) co-staining of a section of a mouse retinal explant co-cultured with hMo (the inset represents a longer green exposure of the outer nuclear layer). (D) Quantification of TUNEL+nuclei in mouse retinal explants cultured with or without hMo (n = 4/group, Mann Whitney *p=0,028). (E and F) Orthogonal projection of confocal Z stack images of the photoreceptor segments of mouse retinal explants after 18 hr of mono-culture (E) or co-culture with hMo (F) after cone arrestin (red)/peanut agglutinin (PNA, green) staining. (G) Quantification of cone numbers in retinal explants cultured with or without hMo (n = 10/group). (H and I) Oblique-, and perpendicular (insets) -3D reconstruction views of confocal Z stack images of the photoreceptor segments of mouse retinal explants after 18 hr of mono-culture (H) or co-culture with hMo (I) after peanut agglutinin (PNA, green) and cone-arrestin (red, insets) staining. (J) Quantification of cone segment volume in mouse retinal explants cultured without or with the indicated numbers of hMos (n = 6/group, Mann Whitney *p<0,0004). (K) Quantification of cone segment volume in mouse retinal explants cultured without or with 100 000 Cx3cr1-deficient bone marrow-derived Mos (n = 4–6/group, Mann Whitney *p<0,0061). (L and M) Orthogonal-, and perpendicular (insets) -3D reconstruction views of confocal Z stack images of the photoreceptor segments of macaque retinal explants after 18 hr of mono-culture (L) or co-culture with hMo (M) after peanut agglutinin (PNA, red) and cone-arrestin (green) staining. (N) Quantification of cone segment volume in macaque retinal explants cultured without or with 100 000 hMos (n = 8/group, Mann Whitney *p<0,0002). hMo/Mo : human monocyte; arr: cone-arrestin; CS : cone segments; PNA : peanut agglutinin. Scale bar : A–F = 50 μm; H and I = 10 μm.

