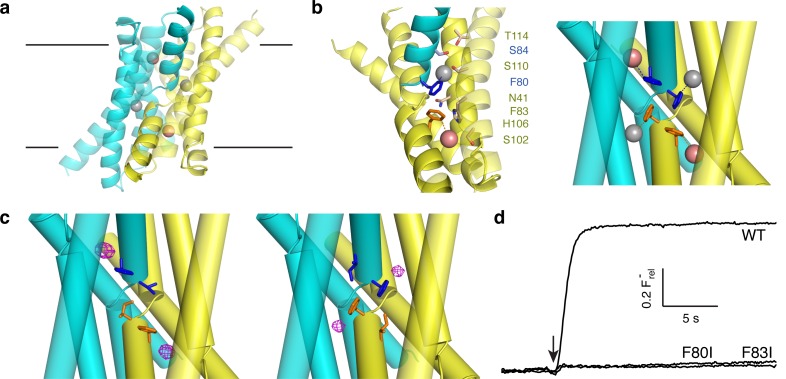
Figure 1. Fluoride ions in Fluc-Ec2 channels.
(a) View of Ec2 channel imagined in membrane (black lines) with subunits colored cyan and yellow and F1-, F2- ions indicated by grey, pink spheres, respectively. From PDB #5A43, rerefined to 2.56 Å resolution. (b) Ion-coordinating region of WT Ec2. 'Polar track' along one pore (left), and detail of the F−-binding Phe-box region (right). The polar track and Phe-box contain residues from both dimer subunits, with sidechains colored accordingly. (c) Phe-box region of F80I (left) or F83I (right) crystal structures (PDB 5KBN, 5KOM, respectively). F−-omit difference densities are shown in magenta, contoured at 4 σ. (d) F− flux traces of indicated Fluc variants. Vertical scale bar represents F− appearing in external medium after addition of valinomycin (arrow).


