Abstract
Purpose
Lower urinary tract symptoms are a common finding in patients with chronic prostatitis/chronic pelvic pain syndrome (CP/CPPS). We reported that the mast cell-tryptase-PAR2 axis plays a critical role in the development of chronic pain in experimental autoimmune prostatitis (EAP), a mouse model of CP/CPPS. We therefore examined whether PAR2 activation mediates lower urinary tract dysfunction.
Materials and Methods
Functional cystometry was used in male B6 mice along with immunoblots and immunohistochemistry for expression of collagen type I alpha I (COL1A1) and alpha-smooth muscle actin (α-SMA). Flow cytometric analysis was performed on single cell suspensions of the prostate, bladder, lymph nodes and spleen.
Results and Conclusions
EAP resulted in increased urinary voiding frequency and decreased bladder capacity thirty days after initiation. Concurrently there was increased expression of collagen type I alpha I (COL1A1) and alpha-smooth muscle actin (α-SMA) in the prostates and bladders. In contrast, induction of EAP in PAR2 KO mice did not result in altered urodynamics or increased markers of fibrosis in the prostate or the bladder. Single cell suspensions of the prostate, bladder, lymph nodes and spleen demonstrated that in the absence of PAR2, cellular inflammatory mechanisms were still initiated in EAP but PAR2 expression may be required for maintenance of chronic inflammation. Finally, we demonstrated that antibody mediated PAR2 neutralization normalized urinary voiding frequency and bladder capacity and attenuated chronic pelvic pain. PAR2 activation in the prostate may thus contribute to the development of lower urinary tract dysfunction through proinflammatory as well as profibrotic pathways.
Keywords: PAR2, prostatitis, fibrosis, urinary, dysfunction
Introduction
Chronic prostatitis/chronic pelvic pain syndrome is a disorder characterized by severe pain originating from the pelvic region (prostate, urethra, perineum, and genitals) and the gradual manifestation of lower urinary tract symptoms (LUTS) (urgency, incontinence, and altered frequency in voiding) via unknown pathological mechanism.1 Previously our laboratory reported that the expressed prostatic secretion (EPS) from CP/CPPS patients contained increased levels of tryptase-β compared to healthy volunteers.2 In experimental autoimmune prostatitis (EAP), a murine model of CP/CPPS, there was elevated expression of the tryptase-β homolog, mMCP6 in the prostates along with increased activation of the G-protein coupled receptor protease-activated receptor 2 (PAR 2).2
Separate studies have established the importance of PAR2 in the maintenance of chronic visceral pain3 and inflammation.4 Moreover, studies have revealed that PAR2 activation by tryptase lead to profibrotic events in fibroblasts5 and the conversion of arachidonic acid to inflammatory prostaglandins.6 Human testicular biopsies from men with aberrant spermatogenesis and fibrotic changes have demonstrated increased numbers of active mast cells that were positive for tryptase.5,7 In models of kidney fibrosis, PAR2 acts as a synergist to elicit profibrotic signaling via intracellular phosphorylation of the epidermal growth factor (EGF) and tumor growth factor-beta (TGF-β) receptors.8
These studies suggest that PAR2 activation may contribute to pathologic fibrosis in multiple organs and lead us to hypothesize that typtase-PAR2 activation may be a mediator of lower urinary tract dysfunction. Therefore, our current studies assessed the link between fibrosis and bladder dysfunction in mice with EAP. First, we established the emergence of prostate/bladder fibrosis due to the induction of EAP. Second, we explored the role of tryptase-PAR2 activation in urinary bladder dysfunction. Third, we determined whether PAR2 neutralization diminishes urinary bladder dysfunction. Overall, these studies revealed a promising therapeutic target for LUTS in CP/CPPS and consider an unexplored potential cause of lower urinary tract dysfunction.
Materials and Methods
Animals
Experiments were conducted on male C57BL/6J (B6) and PAR2 deficient mice (B6.Cg-F2rl1tm1mslb/J) (PAR2 KO) mice, 5–7 weeks old, obtained from Jackson Laboratory (Bar Harbor, ME). Mice used for all experiments were age matched wild type littermates. Water and food was provided ad libitum. Animal experiments and surgical procedures were approved by the Northwestern University Animal Care and Use Committee.
EAP induction and treatment
As previously described by our lab, EAP was induced via a subcutaneous injection of rat prostate antigen (rat prostate lysate) diluted (1 mg/ml) with adjuvant.9 Therapeutic treatment with PAR2-antibody (SAM11; 1 μg; Santa Cruz; sc-13504) or control, rat IgG (1 μg; R&D systems; MAB006), occurred at day 10 and were administered intraperitoneally (IP) every four days.10 Injections were applied between 10 a.m. and 12 p.m.
Behavioral pelvic pain assessment
Mice were assessed for pelvic pain as previously described by Quick et al.11 Plexiglass chambers (6×10×12 cm) that contained a stainless steel mesh floor were constructed and placed on a flat surface elevated 2 feet. To determine the development of pelvic allodynia, von Frey filaments calibrated with forces 0.04, 0.16, 0.4, 1, and 4 g were each applied 10 times with increasing force order to the suprapubic region.
Cystometry
Cystometric recordings occurred in mice under anesthetized conditions (urethane; 1.5 g/kg, IP) as previously described12, with minor modifications. Briefly, a small incision (~2 mm) was made on the dome of the bladder and a polyethylene (PE50) catheter (flared tip) was placed inside the bladder through the incision. The incision was closed and the PE50 tube was secured in place with suture silk (6-0). The catheter was connected via a 3-way valve to a syringe pump (Razel A99) and pressure transducer (Gould Statham P23). Saline kept at 37°C was infused at a constant rate (1.3 ml/hr) for 1.5 hr. The pressure transducer relayed continuous recording of the intravesical pressure to a Grass polygraph (amplifier) and the recordings were digitally converted via a Powerlab/4SP (AD Instruments). The following cystometric parameters were measured during the last (stable) 30 min of recording: void rate, average maximum pressure, bladder capacity and compliance. As previously described by Lee et al., the bladder capacity was defined as the intervoid interval multiplied by the infusion rate and bladder compliance was defined as the bladder capacity over the change in pressure.13
Histological and Immunohistochemical Assays
Tissues were excised and processed from mice after each cystometric recording. The prostates and bladders were sectioned and processed by the Northwestern Mouse Pathology Core. Briefly, tissues were fixed in 10% formalin, embedded in paraffin, sectioned (5 microns), and placed on glass slides. To determine collagen content sections were stained with Masson’s trichrome. Sections prepared for immunohistochemistry were placed in blocking solution for 1 hr at room temperature. Next, sections were incubated with either rabbit anti-alpha-smooth muscle actin (1:50; Novus) or rabbit IgG isotype control (1:50; Santa Cruz) at 4°C overnight. The sections were washed 3 times in PBS for 5 min and placed in anti-rabbit IgG-horseradish peroxidase (HRP) secondary antibody (1:400; Santa-Cruz) for 1–2 hrs at room temperature. Images were viewed with a Leica DMI 6000B inverted microscope with either a 10X or 20X objective.
Flow Cytometry
Flow cytometry was performed on single cell suspensions of splenic, iliac lymph node, bladder and prostate tissues. Tissues were made into single cell suspensions by passing through 40 μm mesh filter membranes to remove debris and washing with 2% FCS (HyClone) in PBS (Gibco). Samples were then fixed and permeabilized using fixation-permeabilization buffers (eBioscience Cat. Numbers 8222-49 and 8333-56), according to manufacturer’s instructions. Following this cells were stained with the following mouse antibodies (Ly6G-FITC, Ly6C-PE, IL4-PE, B220-PE, CD3-PerCp, CD86-PerCp, CD11b-APC, IL17A-APC (eBioscience), CD8-FITC, IFNγ-FITC, CD4-PerCp, CD4-APC (Biolegend)), and run on an Accuri benchtop C6 cytometer. Results were analyzed using FlowJo™ software and statistics generated using Prism™ software from GraphPad.
Statistical Analysis
Data were analyzed with GraphPad Prism (version 6.0) and were represented as mean ± SEM. A two-tailed student t-test was applied to experiments. A one-way ANOVA (nonparametric) followed by LSD Fisher multiple comparison post-hoc was used to compare all experimental groups to respective control group. Data were considered statistically significant different if p<0.05.
Results
EAP induces increased collagen deposition in the prostate
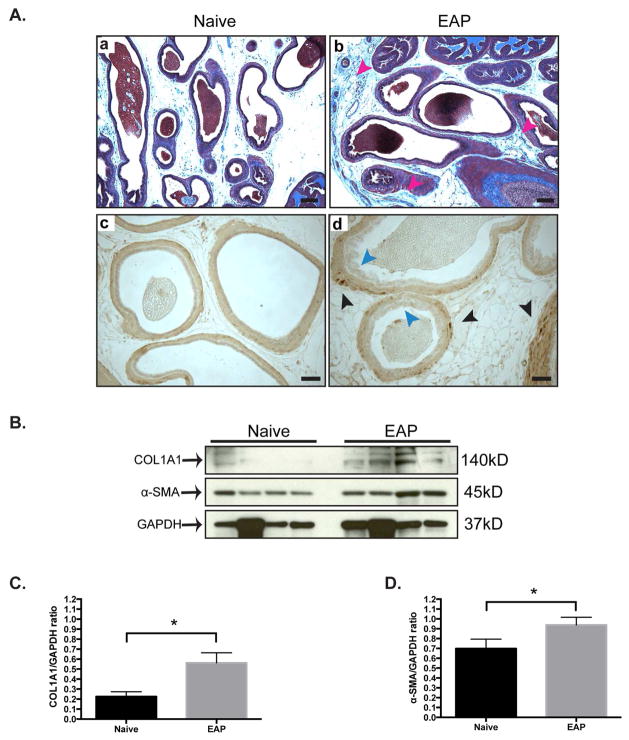
Qualitative Masson’s trichrome staining of the dorsolateral prostate from B6 mice with EAP showed increased collagen deposition (blue) in the stroma (red arrows) at day 30, compared to control mice (Fig. 1Aa–b). Next, immunohistochemical staining of the prostates revealed increased labeling of α-SMA (black arrows) in mice with EAP compared to control (Fig. 1Ac–d). We confirmed these results by immunoblotting for COL1A1 and α-SMA (Fig. 1B). Densitometry analysis of the immunoblots verified increased expression of COL1A1 (177%) and α-SMA (37%) in mice with EAP compared to control (Fig. 1C&D). These results suggest that EAP leads to increased fibrosis in the prostates of B6 mice.
Figure 1. Mice with EAP have prostatic fibrosis.
(Aa–b) Qualitative Masson’s trichrome staining of the dorsolateral prostate in mice (n=4/group). Collagen is labeled blue and the stroma is emphasized by red arrows. Bar represents 100 microns. (Ac–d) Immunohistochemistry labeling with alpha-smooth muscle actin (α-SMA). Bar represents 50 microns. (B) Western blots and (C–D) densitometry analysis for COL1A1 and α-SMA in the prostate of mice. Data represent the mean ± SEM. * denotes p<0.05.
Bladder fibrosis develops in mice with EAP
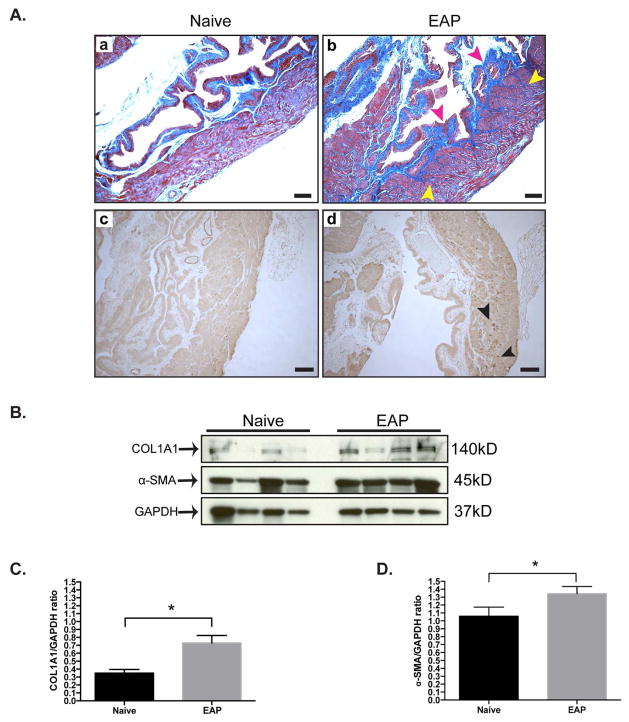
Given our finding that EAP at 30 days was associated with increased prostate fibrosis, we next evaluated whether the bladders in these mice also showed similar effects. Histological assessment of the bladder with Masson’s trichrome stained sections demonstrated that mice with EAP have increased levels of collagen deposition at day 30 compared to control (Fig. 2Aa–b). In particular, the detrusor smooth muscle of the bladder had increased collagen deposition (yellow arrows) compared to control (Fig. 2b). Collagen deposition was observed to be predominantly in the lamina propria (red arrows) and underlying the urothelium of the bladder (Fig. 2a). Histological staining of the bladder at day 30 for α-SMA showed increased expression (black arrows) at the detrusor smooth muscle layer, compared to respective control (Fig. 2Ac–d). To verify the histochemical results we performed Western blot analysis for COL1A1 and α-SMA (Fig. 2B). The densitometry data showed significantly increased expression of COL1A1 (145%) and α-SMA (27%) in B6 mice with EAP and respective controls (Fig. 2C–D). These results show that EAP is also associated with increased fibrosis of the bladder in addition to its effects on the prostate.
Figure 2. Fibrotic markers are elevated in the bladder of EAP mice.
(Aa–b) Representative Masson’s trichrome staining of the bladder from B6 mice (n=4/group). Collagen is labeled blue and the detrusor layer and lamina propria are highlighted by yellow and red arrows, respectively. Bars represent 100 microns. (Ac–d) Immunohistochemistry staining of the bladder. The detrusor layer is indicated by black arrows and bars represent 100 microns. (B) Immunoblot from the bladder of EAP mice. (C–D) Quantitative immunoblot analysis. Data represent the mean ± SEM. *denotes p<0.05.
EAP leads to urinary bladder dysfunction
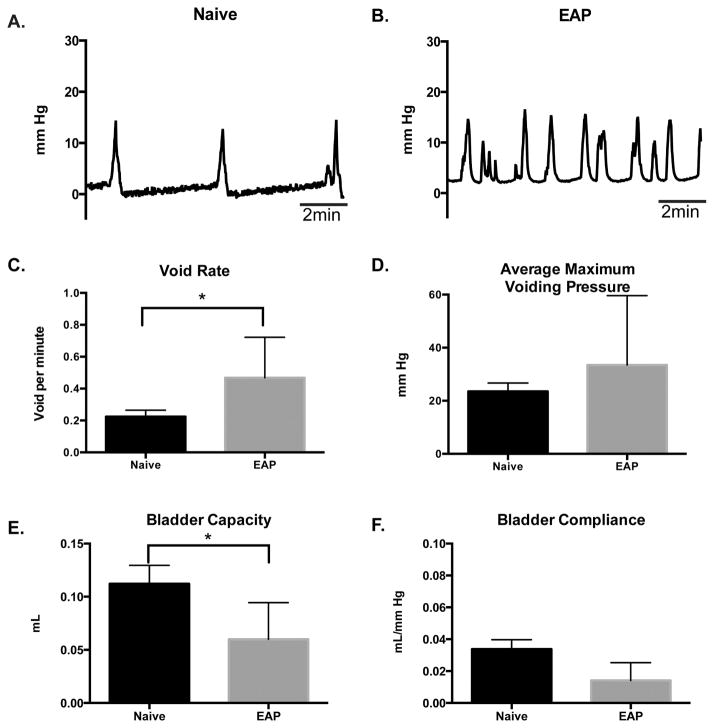
To determine if the emergence of fibrosis in the prostate and bladder from mice with EAP altered the physiological function of the bladder, we conducted anesthetized cystometric recordings at day 30. Analysis of the cystometric tracings (representative; Fig 3A–B) from mice with EAP revealed a significant (95%; p<0.05) increase (0.43±0.094 voids/min) in void rate (contraction), compared to (0.22±0.04 voids/min) control (Fig. 3C). Moreover, the bladder capacity of mice with EAP showed a significant (47%; p<0.05) reduction (0.059±0.01 ml), compared to control (0.112±0.01 ml) (Fig. 3E). However, the cystometric tracings showed no significant difference in the average maximum voiding pressure from the bladder of EAP mice (24.13±8.6 mmHg) compared to control (21.6±3.1 mmHg) (Fig. 3D). Although we recorded a slight reduction in bladder compliance between mice with EAP (0.014±0.03 ml/mmHg) and control (0.033±0.005 ml/mmHg), the difference was not statistically significant (Fig. 3F). These findings indicate that mice with EAP develop urinary bladder dysfunction.
Figure 3. Cystometric data reveal bladder dysfunction.
(A–B) Representative cystometric tracings (10 minutes) from B6 with EAP, compared to control at day 30. (C–F) Bladder void rate, maximum voiding pressure, capacity, and compliance were quantified in B6 mice with EAP (n=4) and compared to control (n=4). Data represent the mean ± SEM. * denotes p<0.05.
EAP-induced deposition of collagen is abrogated in the absence of PAR2
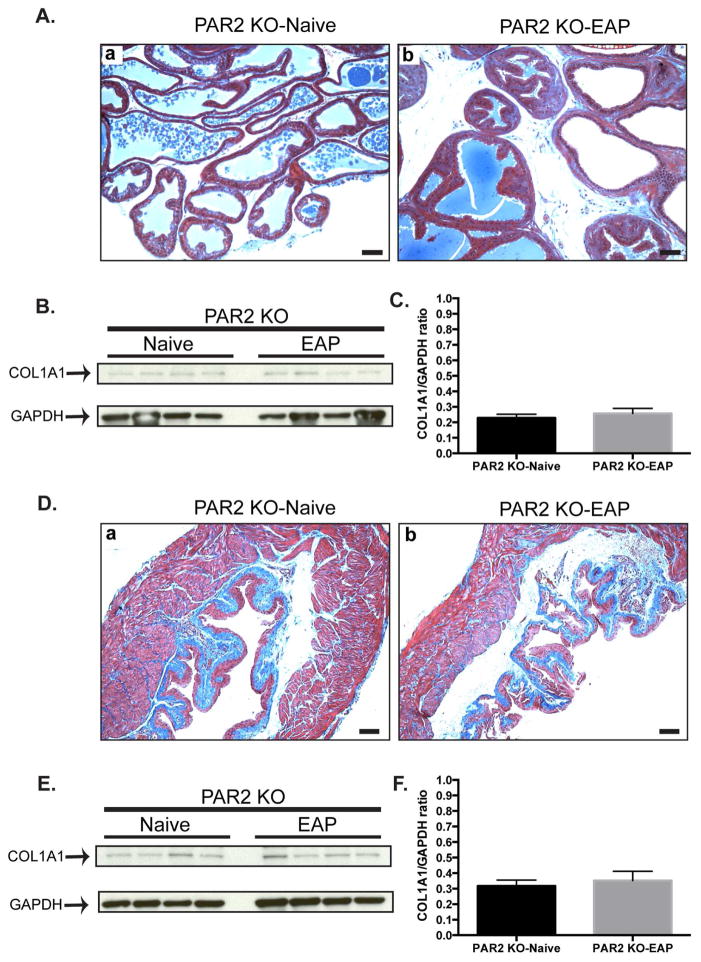
To determine the role of PAR2 in EAP induced fibrosis, the prostate and bladders from PAR2 KO mice with EAP were stained with Masson’s trichrome for total collagen and compared to respective control. Our data showed that PAR2 KO mice with EAP at 30 days do not exhibit higher collagen deposition of the prostate (Fig. 4Aa–b) or bladder (Fig. 4Da–b) at day 30. Also, immunoblot analysis of the prostate (Fig. 4B–C) and bladder (Fig. 4E–F) showed that COL1A1 expression was not altered in PAR2 KO mice with EAP compared to control. These results show that the absence of PAR2 expression abrogates EAP-induced profibrotic events in the prostate and the bladder.
Figure 4. EAP-induced prostate collagen deposition is inhibited in the absence of PAR2.
(Aa–b) Representative Masson’s trichrome staining of the dorsolateral prostate lobe (n=4/group). Bars represent 100 microns. (B) Western blot and (C) densitometry analysis of immunoblot. (Da–b) Representative Masson’s trichrome staining of the bladder. Bars represent 100 microns. (E) Immunoblot and (F) densitometry data in the bladder. Data represent the mean ± SEM.
PAR2 abrogation normalizes urinary bladder function in EAP
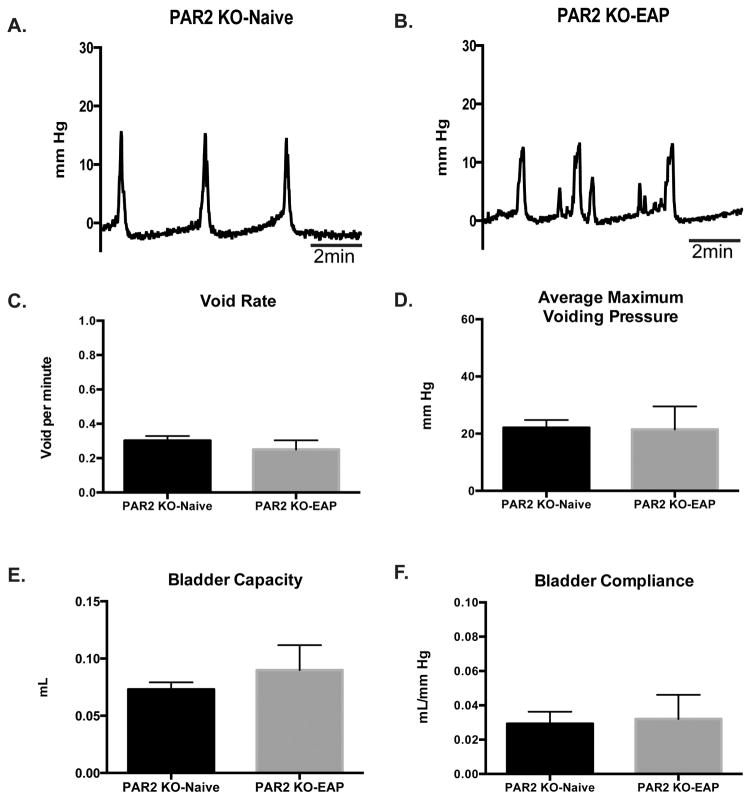
We next examined whether the lack of EAP-induced fibrosis in the absence of PAR2 expression would lead to better outcomes in terms of bladder function. PAR2 KO mice with EAP do not demonstrate aberrant bladder function compared to respective controls (representative; Fig. 5A–B). The void (contraction) rate from PAR2 mice with EAP (0.25±0.02 voids/min) was similar (0.30±0.02 voids/min) to that of the respective control (Fig. 5C) despite evidence of minor alterations in cystometric tracings. Also, the average maximum voiding pressure was unchanged between PAR2 KO with EAP (21.55±3.9 mmHg) and control (22.07±2.7 mmHg) (Fig. 5D). Moreover, PAR2 KO-EAP and PAR2 KO-Naive showed no difference in bladder capacity (0.089±0.01 and 0.073±0.006 ml, respectively) and compliance (0.032±0.01 and 0.029±0.006 ml/mmHg, respectively) (Fig. 5E–F). These results suggest that the absence of PAR2 and the consequent reduction in fibrosis allows for retention of normal bladder function.
Figure 5. Cystometric recordings from PAR2 deficient mice.
(A–B) Representative cystometric tracings at day 30. (C–F) Bladder void rate, maximum voiding pressure, capacity, and compliance were quantified from PAR2 KO mice (n=4) with EAP and compared to respective controls (n=4) at day 30. Data represent the mean ± SEM.
Fibrosis is dependent on persistent inflammation via PAR2 activation
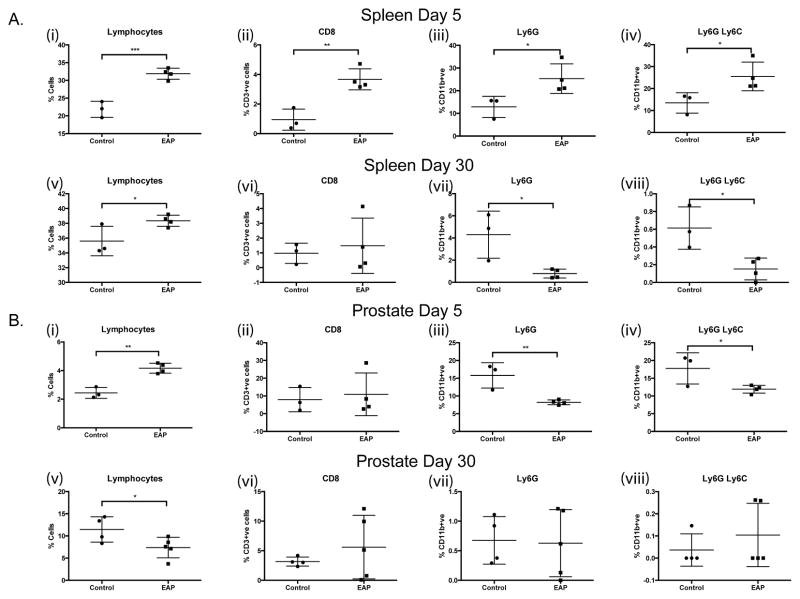
Single cell suspensions from the splenic, prostatic, bladder and iliac lymph node tissues were generated from PAR2 KO mice at 5 and 30 days post-EAP induction and from respective controls. Flow cytometric analyses revealed a significant increase in the proportions of lymphocytes and CD3+ve CD8+ve T-cells in the spleen of EAP mice at day 5 compared to controls, (Fig. 6A(i-ii)). These increases were diminished and/or absent upon analysis of tissues at day 30, (Fig. 6A(v-vi)). Furthermore, increases in both neutrophil populations (CD11b+ve Ly6G+ve) cells and CD11b+ve Ly6G+ve Ly6C+ve, myeloid derived suppressor cells (MDSCs) in splenic tissues observed at day 5 were reversed by day 30 in the absence of PAR2, (Fig. 6A (iii, iv, vii, viii)). Analyses of prostate tissues revealed a similar increase in the numbers of lymphocytes at day 5 but this was reversed by day 30, furthermore the prostate specific loss of innate immune cell populations (neutrophils, monocytes and MDSCs) observed at day 5 was absent in day 30 tissues examined, (Fig. 6B(i-viii)). Data from bladder tissues showed that EAP is capable of initiating B-cell infiltration in the absence of PAR2 but this is lost at day 30 (Table 1). Taken collectively, these data demonstrate that early immune modulation (day 5) can occur upon EAP induction in the absence of PAR2, highlighting the role of the receptor and mast cells in propagating the signals that result in fibrosis development.
Figure 6. Immunophenotyping of EAP in PAR2 KO mice.
Flow cytometry was conducted on the spleen, iliac lymph node, bladder, and prostate tissue from PAR2 KO mice with/without EAP at day 5 and 30. (A) (i–viii) Graphical representations of flow cytometric staining from splenic and (B) (i–viii) prostate tissues, at day 5 and day 30, post-EAP induction for total lymphocytes, CD8 T-cells, Ly6G and Ly6C. Data represent the mean ± SEM. * denotes p<0.05, ** denotes p<0.01, and *** denotes p<0.001.
Table 1. Immunophenotyping summary.
Table depicts all markers analyzed by flow cytometry, including CD4+ve T-cell subsets, and additional tissues including bladder and illiac lymph nodes.
| Spleen | ||||
|---|---|---|---|---|
| Day 5 | Day 30 | |||
| Control | EAP | Control | EAP | |
| Lymphocytes | 21.83 ± 1.302 | 31.88 ± 0.7761 *** | 35.60 ± 1.153 | 38.35 ± 0.3775 * |
| B220 | 58.07 ± 2.761 | 56.28 ± 2.052 | 70.73 ± 3.056 | 69.85 ± 2.992 |
| CD3 | 24.87 ± 1.588 | 23.60 ± 0.1225 | 39.00 ± 3.188 | 36.85 ± 5.542 |
| CD8 | 0.9440 ± 0.4133 | 3.673 ± 0.3560 ** | 0.9700 ± 0.3950 | 1.480 ± 0.9337 |
| CD4 | 58.23 ± 5.909 | 55.90 ± 0.6608 | 51.57 ± 1.084 | 53.85 ± 1.864 |
| IL17 | 3.600 ± 3.600 | 0.5643 ± 0.4531 | 0.8487 ± 0.5290 | 0.1480 ± 0.1480 |
| IL4 | 9.110 ± 1.106 | 5.010 ± 1.127 | 0.6680 ± 0.3898 | 0.1480 ± 0.1480 |
| IFNg | 0.0 ± 0.0 | 0.1505 ± 0.08985 | 37.90 ± 3.940 | 46.58 ± 8.100 |
| CD11b | 5.200 ± 2.950 | 1.868 ± 0.1195 | 6.653 ± 1.189 | 3.690 ± 0.4905 # |
| LY6C | 47.67 ± 0.6333 | 52.18 ± 2.677 | 11.45 ± 2.833 | 16.50 ± 2.990 |
| LY6G | 12.87 ± 2.683 | 25.33 ± 3.258 * | 4.300 ± 1.227 | 0.7878 ± 0.2019 # |
| LY6C LY6G | 13.47 ± 2.688 | 25.53 ± 3.265 * | 0.6133 ± 0.1380 | 0.1518 ± 0.06167 # |
| Iliac Lymph Nodes | ||||
| Day 5 | Day 30 | |||
| Control | EAP | Control | EAP | |
| Lymphocytes | 44.77 ± 15.85 | 37.43 ± 7.569 | 24.27 ± 13.69 | 44.73 ± 6.674 |
| B220 | 52.37 ± 0.6960 | 44.53 ± 4.118 | 42.03 ± 1.862 | 32.40 ± 10.99 |
| CD3 | 45.73 ± 1.317 | 54.98 ± 3.738 | 67.43 ± 2.562 | 60.47 ± 2.200 |
| CD8 | 0.2423 ± 0.1119 | 0.3315 ± 0.07877 | 0.8623 ± 0.4178 | 0.2273 ± 0.1018 |
| CD4 | 54.63 ± 1.410 | 56.23 ± 0.4888 | 47.70 ± 2.458 | 51.00 ± 1.819 |
| IL17 | 4.627 ± 2.105 | 3.650 ± 1.172 | 2.877 ± 0.8032 | 0.8705 ± 0.3167 # |
| IL4 | 20.93 ± 3.869 | 16.83 ± 3.947 | 10.48 ± 2.859 | 3.170 ± 1.025 # |
| IFNg | 4.610 ± 3.098 | 3.703 ± 1.999 | 23.40 ± 7.121 | 12.02 ± 3.044 |
| CD11b | 1.544 ± 0.5515 | 0.7875 ± 0.1631 | 11.75 ± 1.078 | 9.700 ± 1.729 |
| LY6C | 62.70 ± 7.006 | 54.10 ± 3.649 | 17.13 ± 5.079 | 14.05 ± 1.850 |
| LY6G | 1.747 ± 0.9697 | 1.845 ± 0.5094 | 0.4513 ± 0.1049 | 0.1770 ± 0.06659 |
| LY6C LY6G | 6.513 ± 2.798 | 6.225 ± 2.507 | 0.1840 ± 0.02635 | 0.1353 ± 0.06635 |
| Bladder | ||||
| Day 5 | Day 30 | |||
| Control | EAP | Control | EAP | |
| Lymphocytes | 2.217 ± 0.2826 | 2.283 ± 0.3259 | 4.108 ± 1.058 | 4.132 ± 0.6700 |
| B220 | 20.07 ± 1.934 | 29.58 ± 1.160 ** | 38.73 ± 3.460 | 34.74 ± 8.061 |
| CD3 | 20.67 ± 2.368 | 17.65 ± 1.144 | 22.85 ± 3.723 | 23.10 ± 3.481 |
| CD8 | 7.797 ± 2.134 | 20.95 ± 3.825 ** | 5.103 ± 2.207 | 7.412 ± 3.221 |
| CD4 | 16.22 ± 5.236 | 16.88 ± 2.924 | 30.45 ± 5.023 | 36.26 ± 0.6809 |
| IL17 | 7.043 ± 3.891 | 5.615 ± 1.544 | 8.585 ± 1.265 | 8.302 ± 1.785 |
| IL4 | 46.50 ± 6.409 | 50.33 ± 11.16 | 18.55 ± 2.663 | 29.30 ± 3.592 |
| IFNg | 32.37 ± 3.333 | 33.38 ± 8.834 | 50.50 ± 9.130 | 44.36 ± 3.510 |
| CD11b | 2.963 ± 0.4014 | 2.078 ± 0.6167 | 13.85 ± 2.260 | 24.22 ± 2.426 * |
| LY6C | 21.27 ± 3.174 | 30.95 ± 3.955 | 18.53 ± 2.648 | 20.86 ± 2.158 |
| LY6G | 6.030 ± 1.148 | 11.64 ± 2.215 | 2.268 ± 1.004 | 3.946 ± 0.8558 |
| LY6C LY6G | 8.117 ± 1.281 | 14.93 ± 2.361 | 0.2448 ± 0.2448 | 0.5280 ± 0.1477 |
| Prostate | ||||
| Day 5 | Day 30 | |||
| Control | EAP | Control | EAP | |
| Lymphocytes | 2.440 ± 0.2219 | 4.165 ± 0.1737 ** | 11.46 ± 1.426 | 7.378 ± 1.033 # |
| B220 | 14.10 ± 6.403 | 4.750 ± 1.275 | 11.90 ± 1.259 | 23.42 ± 5.434 |
| CD3 | 11.26 ± 1.410 | 7.058 ± 0.4664 # | 12.85 ± 1.069 | 24.20 ± 8.746 |
| CD8 | 7.900 ± 3.952 | 10.90 ± 6.023 | 3.165 ± 0.3784 | 5.606 ± 2.402 |
| CD4 | 32.80 ± 10.18 | 11.62 ± 2.998 | 26.03 ± 1.956 | 30.28 ± 4.287 |
| IL17 | 2.007 ± 1.114 | 5.155 ± 2.994 | 6.420 ± 1.257 | 4.998 ± 1.742 |
| IL4 | 21.76 ± 6.564 | 27.30 ± 9.793 | 15.40 ± 5.471 | 14.80 ± 6.804 |
| IFNg | 11.51 ± 3.513 | 7.700 ± 4.449 | 39.35 ± 8.275 | 42.02 ± 12.61 |
| CD11b | 0.9707 ± 0.2748 | 0.6270 ± 0.05433 | 16.90 ± 1.358 | 14.89 ± 2.696 |
| LY6C | 36.97 ± 4.117 | 27.25 ± 1.009 # | 8.925 ± 2.032 | 8.162 ± 1.029 |
| LY6G | 15.80 ± 2.066 | 8.208 ± 0.3340 ## | 0.6750 ± 0.2013 | 0.6272 ± 0.2537 |
| LY6C LY6G | 17.77 ± 2.544 | 11.90 ± 0.5492 # | 0.0365 ± 0.0365 | 0.1042 ± 0.06381 |
Asterisk(s) depict increased levels in EAP mice compared to control. In contrast, #’s show decreased levels compared to control. Analyses were conducted on an Acuri C6, analyzed with FlowJo and GraphPad Prism.
denotes p<0.05,
denotes p<0.01, and
denotes p<0.001. N=3–5 mice per group.
PAR2 neutralization mitigates urinary bladder dysfunction
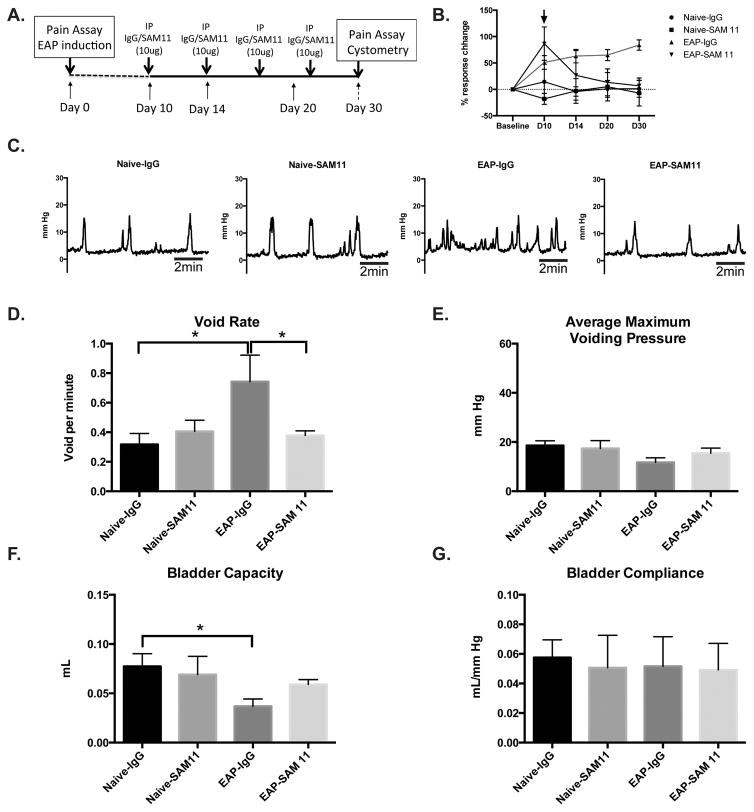
Here, we assessed the potential of SAM11 as a therapeutic treatment to inhibit fibrosis and mitigate the development of urinary bladder dysfunction. Mice with EAP or respective controls received intraperitoneal injections of either an isotype control antibody (IgG) or SAM11 treatment at day 10 and subsequent injections every four days until day 30 (Fig. 7A). Mice with EAP that received SAM11 (EAP-SAM11) did not develop pelvic tactile allodynia after day 10 (Fig. 7B) and there were no significant difference in void rate (0.37±0.03 voids/min), maximum pressure (15.5±2.1 mmHg), bladder capacity (0.062±0.005 ml), and compliance (0.052±0.02 ml/mmHg) at day 30, compared to controls, Naive-IgG (0.31±0.08 voids/min; 18.5±1.9 mmHg; 0.08±0.01 ml; 0.059±0.011 ml/mmHg, respectively) or Naive-SAM11 (0.41±0.075 voids/min; 17.4±3.2 mmHg; 0.73±.0.02 ml; 0.053±0.02 ml/mmHg, respectively) (Fig 7C–G). In contrast, mice with EAP that were administered IgG (EAP-IgG) had increased pelvic tactile allodynia at days 7, 14, 20, and 30 (Fig. 7B) and a significantly higher (83–135%; p<0.05) void rate (0.74±0.19 voids/min) (Fig 7D), and a decreased (37–52%; p<0.05) bladder capacity (0.038±0.007 ml) (Fig. 7F), compared to EAP-SAM11 and controls. Similar to our previous data, the average maximum voiding pressure and bladder compliance were not significantly changed between treatment groups (Fig. 7E and 7G). These results show that therapeutic inhibition of PAR2 may be of utility in both EAP induced pelvic pain and urinary bladder dysfunction.
Figure 7. Treatment with anti-PAR2 antibody (SAM11) mitigates pelvic pain and urinary dysfunction.
(A) Experimental design of antibody treatment. (B) Behavioral assay to determine the development of hyperalgesia/allodynia over time. (C) Representative cystometric recordings (10 minutes) from IgG or SAM11 treatment groups (n=4 each). (D–G) Analysis of cystometric recordings provided void rate, voiding pressure, capacity, and compliance at day 30 from mice. Data represent the mean ± SEM. * denotes p<0.05.
Discussion
Mouse models of lower urinary tract dysfunction have shown that prostatic and urethral tissue fibrosis can be linked to urinary voiding dysfunction.14 Although we have previously reported on the development of prostate inflammation and increased pelvic tactile allodynia of mice with EAP, the consequence on prostate fibrosis is not clear.15 In this study we determined that, at day 30, increased collagen deposition occurred in the stroma of the prostate in mice with EAP, a time point coincident with increased mast cell degranulation and PAR2 expression in the prostate.2 Interestingly, in a model of benign prostatic hyperplasia, E.coli induced prostate inflammation over an 8-week period significantly increased deposition of collagen in the dorsolateral prostate stroma and parallels our immunohistochemical stains conducted in the same region.16 Moreover, human prostate fibroblast cultures exposed to chemokines are strongly associated with higher expression of collagen and α-SMA.17 Our studies confirmed higher levels of α-SMA expression located in the smooth muscle surrounding the prostate glands. In the bladder of mice with EAP, we observed and quantified higher collagen deposition and α-SMA expression in the detrusor muscle. Cystometric recordings of the bladder from EAP mice demonstrated an increased frequency of micturition and decreased bladder capacity. Although normal bladder compliance was unexpected in profibrotic EAP mice, our results are similar to a murine model of bladder outlet obstruction that showed no difference in bladder compliance despite increased detection of α-SMA and collagen deposition in the bladder at 13 weeks.18 Taken together, the aberrant extracellular matrix remodeling of the prostate and bladder wall (detrusor muscle) due to ongoing fibrosis are key contributing factors of voiding dysfunction in mice with EAP.
Persistent PAR2 activation leads to maintenance of pain and inflammation in multiple mouse models. Studies suggest that autoimmunity contributes to profibrotic signaling in a model of sclerosis.19 We have published that PAR2 KO mice with EAP have reduced pelvic allodynia at day 30.2 Thus, we hypothesized that the tryptase-PAR2 axis plays a key role in the maintenance of profibrotic events in an autoimmune mouse model of CP/CPPS. Here, we confirmed that collagen deposition is blunted in the prostate and bladders of PAR2 KO with EAP at day 30. In addition, cystometric recordings showed no difference in bladder function parameters between PAR2 KO with EAP and respective control. Similarly, studies on mouse models of kidney and lung fibrosis reported that PAR2 deficient mice have reduced inflammation and mitigated fibrosis.8,20 Also, our current study analyzed the inflammatory profile of PAR2 KO mice with EAP. Previous publications from our laboratory have demonstrated that EAP induced immune activation in prostate tissues is mediated by adaptive T-cell immune responses, specifically Th17 cells.21 We hypothesized that PAR2 may mediate maintenance of inflammatory signals via mast cells and in doing so contribute to fibrosis. To address this we performed flow cytometry for a number of adaptive and innate immune cell markers at 5 and 30 days post-EAP induction in PAR2 KO mice. The results suggest that PAR2 KO mice with EAP develop acute prostatic inflammation that is not sustained at day 30. Consequently, the absence of PAR2 affects the maintenance of inflammation that is required for the progression of fibrosis. Overall, our results support PAR2 as a critical mediator of pelvic pain and lower urinary tract dysfunction and a potential therapeutic target.
Studies conducted on CP/CPPS patients revealed that urinary symptoms were higher in patients experiencing the most severe pain.22 Studies conducted with PAR2 neutralizing antibody or antagonists demonstrate mitigated joint inflammation in models of arthritis.23,24 Here, we confirmed that PAR2 neutralization mitigates pelvic allodynia (after induction) and provide new evidence that early intervention via SAM11 reduces fibrosis induced urinary bladder dysfunction.
Conclusions
In summary, we established that fibrosis of the prostate and bladder lead to lower urinary tract dysfunction in an animal model of CP/CPPS. Furthermore, our results indicated that activation of the tryptase-PAR2 axis is important for the emergence of fibrosis. In addition, we report encouraging results with the PAR2 neutralizing antibody by abrogating pelvic pain and reducing lower urinary tract dysfunction elicited by fibrosis. Our main findings demonstrate that the tryptase-PAR2 axis modulates symptoms associated with CP/CPPS and that therapeutic inhibition of PAR2 is an attractive therapeutic option.
Acknowledgments
Research reported in this publication was supported by the National Institute of Diabetes And Digestive And Kidney Diseases of the National Institute of Health under Award Numbers F32DK104544 (to KR) and R01DK094898 (to PR).
Key of Definitions
- EAP
Experimental autoimmune prostatitis
- CP/CPPS
Chronic prostatitis/Chronic pelvic pain syndrome
- COL1A1
Collagen type 1 alpha 1
- α-SMA
Alpha smooth muscle actin
- PAR2
Protease activated receptor 2
- LUTS
Lower urinary tract symptoms
Footnotes
The authors do not have a conflict of interest to declare.
Publisher's Disclaimer: This is a PDF file of an unedited manuscript that has been accepted for publication. As a service to our customers we are providing this early version of the manuscript. The manuscript will undergo copyediting, typesetting, and review of the resulting proof before it is published in its final citable form. Please note that during the production process errors may be discovered which could affect the content, and all legal disclaimers that apply to the journal pertain.
References
- 1.Schaeffer AJ, Datta NS, Fowler JE, Jr, et al. Overview summary statement. Diagnosis and management of chronic prostatitis/chronic pelvic pain syndrome (CP/CPPS) Urology. 2002;60:1. doi: 10.1016/s0090-4295(02)01979-9. [DOI] [PubMed] [Google Scholar]
- 2.Roman K, Done JD, Schaeffer AJ, et al. Tryptase-PAR2 axis in experimental autoimmune prostatitis, a model for chronic pelvic pain syndrome. Pain. 2014;155:1328. doi: 10.1016/j.pain.2014.04.009. [DOI] [PMC free article] [PubMed] [Google Scholar]
- 3.Tillu DV, Hassler SN, Burgos-Vega CC, et al. Protease-activated receptor 2 activation is sufficient to induce the transition to a chronic pain state. Pain. 2015;156:859. doi: 10.1097/j.pain.0000000000000125. [DOI] [PMC free article] [PubMed] [Google Scholar]
- 4.Suen JY, Barry GD, Lohman RJ, et al. Modulating human proteinase activated receptor 2 with a novel antagonist (GB88) and agonist (GB110) Br J Pharmacol. 2012;165:1413. doi: 10.1111/j.1476-5381.2011.01610.x. [DOI] [PMC free article] [PubMed] [Google Scholar]
- 5.Frungieri MB, Weidinger S, Meineke V, et al. Proliferative action of mast-cell tryptase is mediated by PAR2, COX2, prostaglandins, and PPARgamma : Possible relevance to human fibrotic disorders. Proc Natl Acad Sci U S A. 2002;99:15072. doi: 10.1073/pnas.232422999. [DOI] [PMC free article] [PubMed] [Google Scholar]
- 6.Frungieri MB, Albrecht M, Raemsch R, et al. The action of the mast cell product tryptase on cyclooxygenase-2 (COX2) and subsequent fibroblast proliferation involves activation of the extracellular signal-regulated kinase isoforms 1 and 2 (erk1/2) Cell Signal. 2005;17:525. doi: 10.1016/j.cellsig.2004.09.017. [DOI] [PubMed] [Google Scholar]
- 7.Meineke V, Frungieri MB, Jessberger B, et al. Human testicular mast cells contain tryptase: increased mast cell number and altered distribution in the testes of infertile men. Fertil Steril. 2000;74:239. doi: 10.1016/s0015-0282(00)00626-9. [DOI] [PubMed] [Google Scholar]
- 8.Chung H, Ramachandran R, Hollenberg MD, et al. Proteinase-activated receptor-2 transactivation of epidermal growth factor receptor and transforming growth factor-beta receptor signaling pathways contributes to renal fibrosis. J Biol Chem. 2013;288:37319. doi: 10.1074/jbc.M113.492793. [DOI] [PMC free article] [PubMed] [Google Scholar]
- 9.Rudick CN, Schaeffer AJ, Thumbikat P. Experimental autoimmune prostatitis induces chronic pelvic pain. Am J Physiol Regul Integr Comp Physiol. 2008;294:R1268. doi: 10.1152/ajpregu.00836.2007. [DOI] [PubMed] [Google Scholar]
- 10.Ferrell WR, Lockhart JC, Kelso EB, et al. Essential role for proteinase-activated receptor-2 in arthritis. J Clin Invest. 2003;111:35. doi: 10.1172/JCI16913. [DOI] [PMC free article] [PubMed] [Google Scholar]
- 11.Quick ML, Done JD, Thumbikat P. Measurement of tactile allodynia in a murine model of bacterial prostatitis. J Vis Exp. 2013:e50158. doi: 10.3791/50158. [DOI] [PMC free article] [PubMed] [Google Scholar]
- 12.Uvin P, Everaerts W, Pinto S, et al. The Use of Cystometry in Small Rodents: A Study of Bladder Chemosensation. Jove-Journal of Visualized Experiments. 2012 doi: 10.3791/3869. [DOI] [PMC free article] [PubMed] [Google Scholar]
- 13.Lee SH, Lysiak JJ, Steers WD. Bladder and urethral function in a mouse model of cavernous nerve injury. Neurourol Urodyn. 2013;32:1038. doi: 10.1002/nau.22354. [DOI] [PubMed] [Google Scholar]
- 14.Gharaee-Kermani M, Rodriguez-Nieves JA, Mehra R, et al. Obesity-induced diabetes and lower urinary tract fibrosis promote urinary voiding dysfunction in a mouse model. Prostate. 2013;73:1123. doi: 10.1002/pros.22662. [DOI] [PMC free article] [PubMed] [Google Scholar]
- 15.Done JD, Rudick CN, Quick ML, et al. Role of mast cells in male chronic pelvic pain. J Urol. 2012;187:1473. doi: 10.1016/j.juro.2011.11.116. [DOI] [PMC free article] [PubMed] [Google Scholar]
- 16.Wong L, Hutson PR, Bushman W. Resolution of chronic bacterial-induced prostatic inflammation reverses established fibrosis. Prostate. 2015;75:23. doi: 10.1002/pros.22886. [DOI] [PMC free article] [PubMed] [Google Scholar]
- 17.Gharaee-Kermani M, Kasina S, Moore BB, et al. CXC-type chemokines promote myofibroblast phenoconversion and prostatic fibrosis. PLoS One. 2012;7:e49278. doi: 10.1371/journal.pone.0049278. [DOI] [PMC free article] [PubMed] [Google Scholar]
- 18.Metcalfe PD, Wang J, Jiao H, et al. Bladder outlet obstruction: progression from inflammation to fibrosis. BJU Int. 2010;106:1686. doi: 10.1111/j.1464-410X.2010.09445.x. [DOI] [PubMed] [Google Scholar]
- 19.Kill A, Riemekasten G. Functional autoantibodies in systemic sclerosis pathogenesis. Curr Rheumatol Rep. 2015;17:505. doi: 10.1007/s11926-015-0505-4. [DOI] [PubMed] [Google Scholar]
- 20.Lin C, Von Der Thusen J, Daalhuisen J, et al. Pharmacological targeting of protease activated receptor-2 affords protection from bleomycin-induced pulmonary fibrosis. Mol Med. 2015 doi: 10.2119/molmed.2015.00094. [DOI] [PMC free article] [PubMed] [Google Scholar]
- 21.Murphy SF, Schaeffer AJ, Done J, et al. IL17 Mediates Pelvic Pain in Experimental Autoimmune Prostatitis (EAP) PLoS One. 2015;10:e0125623. doi: 10.1371/journal.pone.0125623. [DOI] [PMC free article] [PubMed] [Google Scholar]
- 22.Tripp DA, Nickel JC, Shoskes D, et al. A 2-year follow-up of quality of life, pain, and psychosocial factors in patients with chronic prostatitis/chronic pelvic pain syndrome and their spouses. World J Urol. 2013;31:733. doi: 10.1007/s00345-013-1067-6. [DOI] [PubMed] [Google Scholar]
- 23.Lohman RJ, Cotterell AJ, Barry GD, et al. An antagonist of human protease activated receptor-2 attenuates PAR2 signaling, macrophage activation, mast cell degranulation, and collagen-induced arthritis in rats. FASEB J. 2012;26:2877. doi: 10.1096/fj.11-201004. [DOI] [PubMed] [Google Scholar]
- 24.Kelso EB, Lockhart JC, Hembrough T, et al. Therapeutic promise of proteinase-activated receptor-2 antagonism in joint inflammation. J Pharmacol Exp Ther. 2006;316:1017. doi: 10.1124/jpet.105.093807. [DOI] [PubMed] [Google Scholar]


