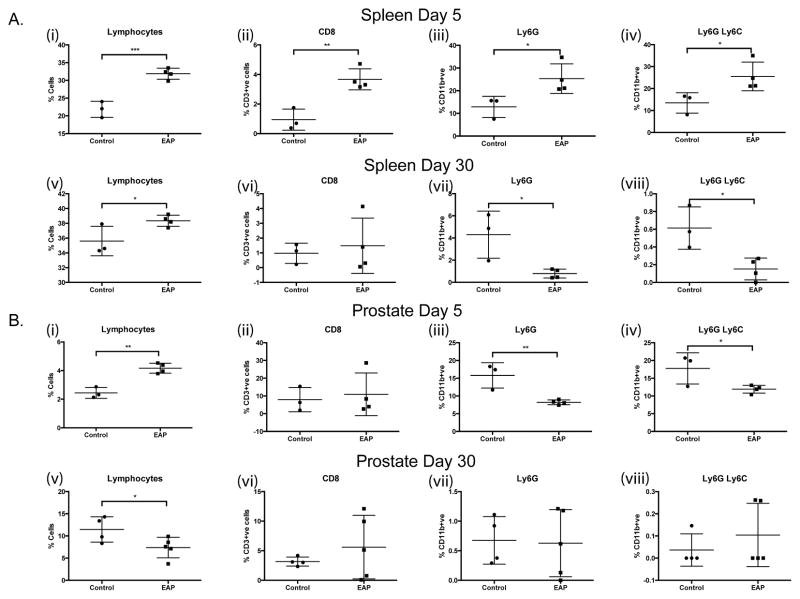
Figure 6. Immunophenotyping of EAP in PAR2 KO mice.
Flow cytometry was conducted on the spleen, iliac lymph node, bladder, and prostate tissue from PAR2 KO mice with/without EAP at day 5 and 30. (A) (i–viii) Graphical representations of flow cytometric staining from splenic and (B) (i–viii) prostate tissues, at day 5 and day 30, post-EAP induction for total lymphocytes, CD8 T-cells, Ly6G and Ly6C. Data represent the mean ± SEM. * denotes p<0.05, ** denotes p<0.01, and *** denotes p<0.001.

