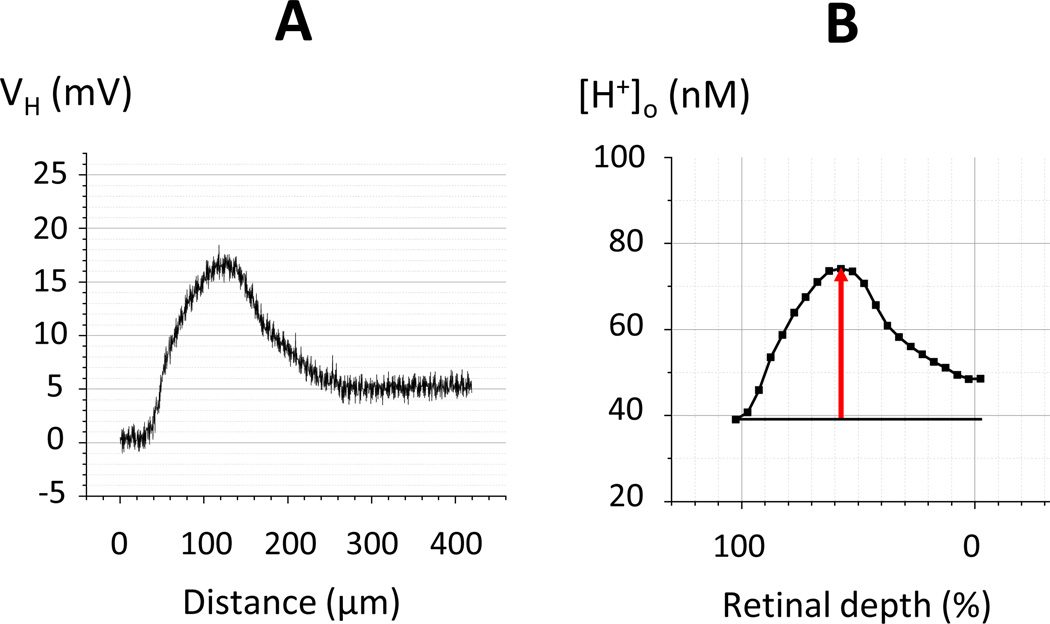
Figure 1. Converting the voltage of the H+-selective microelectrode (A) into a H+-profile (B).
A: The H+ voltage of the H+-selective microelectrode (which is the difference between the voltages of the ion-selective and reference barrels of the double barreled micropipette) consists of 840 data points obtained during 7 min of recording (2 Hz) when the electrode was continuously withdraw from the choroid to the vitreous. B: The final H+-profile that represents the calculated extracellular H+ concentration plotted against the normalized retinal depth consists of 22 data points, 20 for average [H+]o in thin retinal sections (each accounting for 5% of total retinal depth), plus the average [H+] in the choroid and the vitreous just outside of the retina. The horizontal line marks the choroidal [H+]; the arrow shows the amplitude of the H+-profile.

