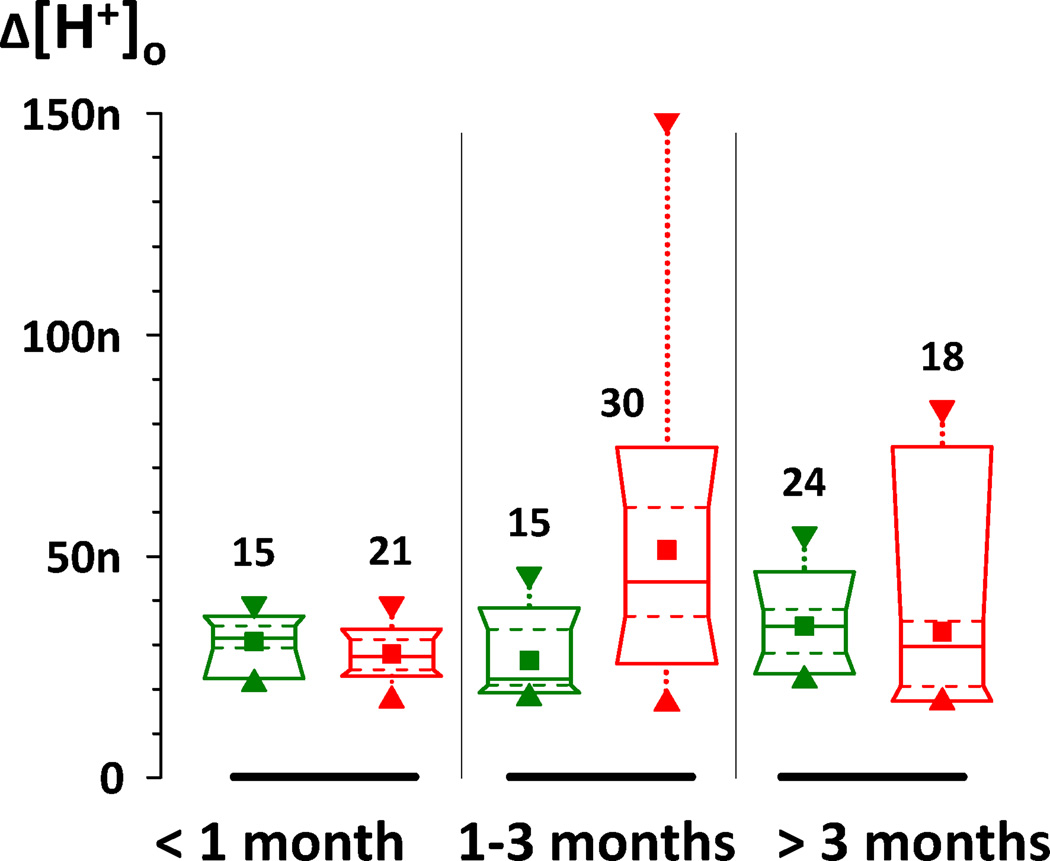
Figure 4. Box charts of H+-profile amplitudes from control (green) and diabetic (red) animals.
Data presented separately for 3 time periods: shorter than 1 month (on the left), 1 to 3 months (in the middle), and 3 to 6 months (on the right). ■ - the mean of profiles recorded from different rats (3 profiles per rat); ▲ – minimum;▼ – maximum; boxes cover from 10% to 90% of the values in each group; solid lines in boxes – median; dashed lines in boxes are 25% and 75%. Numbers of profiles in each group are marked near corresponding boxes.

