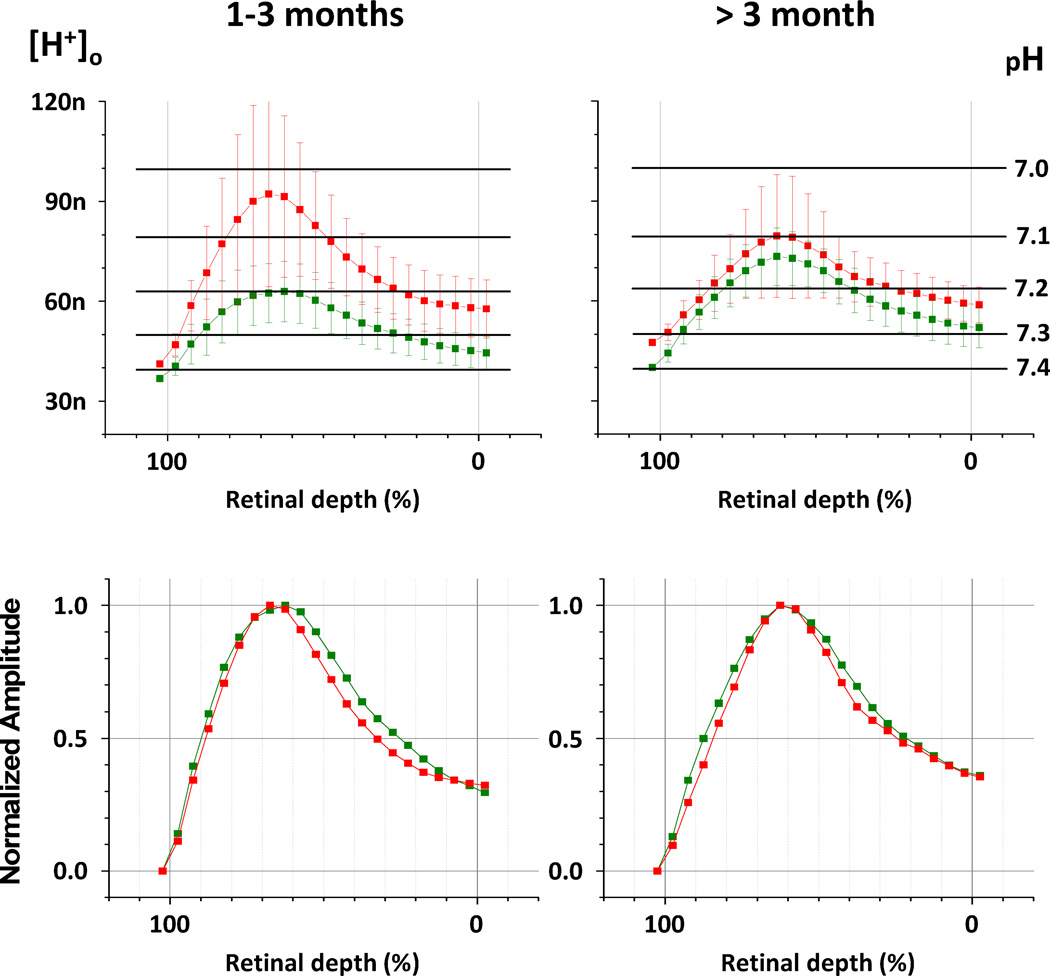
Figure 6. Average H+-profiles in control (green) and diabetic (red) retinae.
Control and diabetic H+-profiles (mean ± s.d.) for 2 time periods: 1 to 3 months (left column), and 3 to 6 months (right column). Upper row – average H+-profiles (mean ± s.e.m.). Numbers of individual profiles used for averaging: 1 – 3 month diabetics = 30, more than 3 month diabetics = 18, 1 – 3 month controls = 15, more than 3 month controls = 24. Lower row – normalized average H+-profiles, when each point is presented relative to maximum amplitude.

