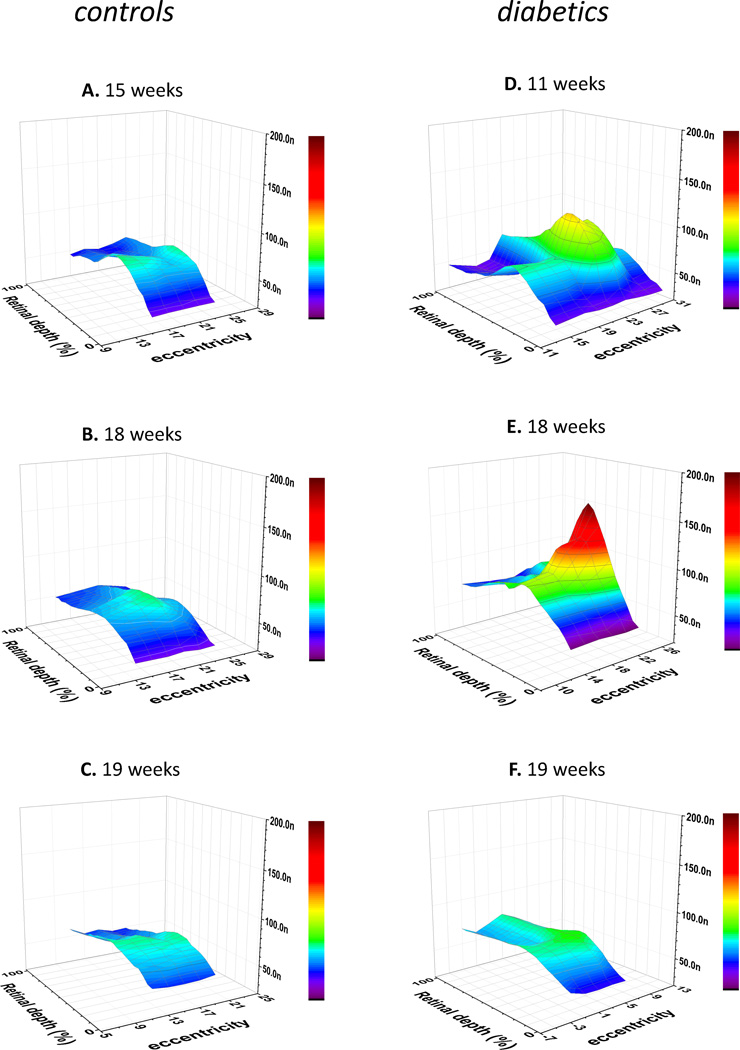
Figure 7. 3D presentation of [H+] distribution in control (A–C) and diabetic (D–F) retinae.
Each part of the figure represents data obtained on individual rats, 5 to 8 H+-profiles per animal. The value of local [H+]o was plotted against two space axes – retinal depth (in %) and eccentricity (in degrees of electrode rotation about the wall of the eye). The time after STZ injection (or vehicle injection in case of control) is marked above each graph. To emphasize the lateral gradients, the distance in the tangential direction is compressed about 4 times compared to the distance in the radial direction.

