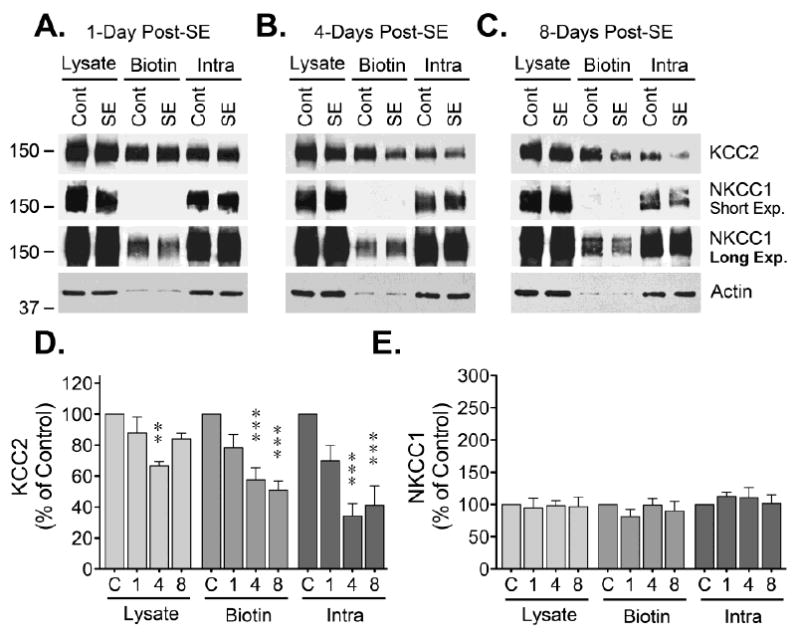
Figure 2. Cell surface expression of CCCs in DG of hippocampus.

After labeling and separation of the biotinylated proteins, lysate, biotinylated and non-biotinylated samples from DG were analyzed by Western blot. (A, B, C) Representative blots showing KCC2, NKCC and actin blots at 1, 4 or 8 days post-SE. (D) Densitometry analysis of KCC2 immunoreactivity normalized to actin is presented as the mean ± SEM of four to five independent experiments. (E) Densitometry analysis of NKCC1 immunoreactivity normalized to actin represented as the mean ± SEM of four to five independent experiments. The signal detected at the different time points after SE was compared to controls by ANOVA followed by Bonferroni post hoc test (**p < 0.01, ***p < 0.001).
