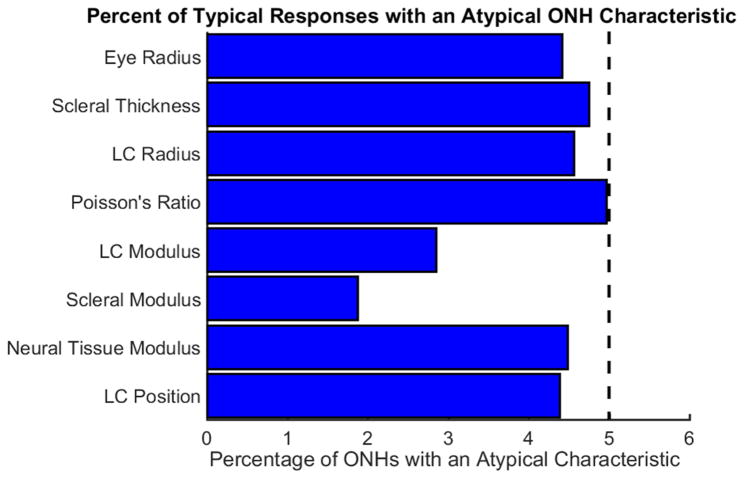
Figure 3.
Typical biomechanical responses arise from ONHs with atypical characteristics. The blue bars indicate the percent of the population of ONHs with typical biomechanical responses that also have the specified atypical characteristics. The black dashed vertical line represents the percentage of ONHs with a specific atypical characteristic in the entire population. For most cases, the percentage of typical responses having a specified atypical characteristic was similar to the percentage of ONHs with that specified characteristic in the population as a whole. The fact that the percentages are non-zero indicates that the answer two question two is no. This plot was computed with a typicality threshold of 95%.

