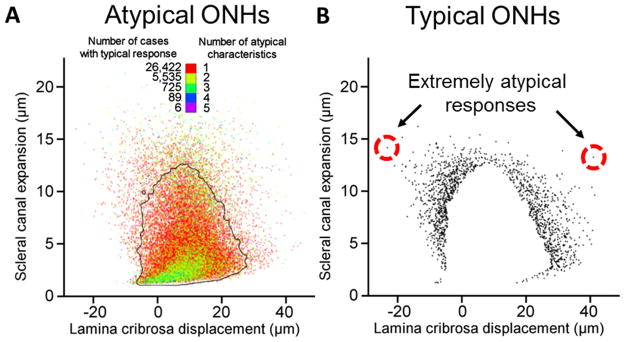
Figure 6.
Biomechanical response distributions. A. The distribution of scleral canal expansion (SCE) and lamina cribrosa displacement (LCD) responses for ONHs classified as atypical (having one or more atypical characteristic). The points are colored by the number of atypical characteristics for that ONH. The black outline represents the 2D 5% atypicality threshold, calculated as the smallest region containing 95% of all responses (Sigal and Grimm, 2012). To decrease plot saturation the pixel intensity is proportional to the number of points overlapping. This means that points in regions with few responses appear dim, whereas the central regions with many points appear dense. It is seen that even for ONHs with multiple atypical characteristics, there is a strong tendency towards the median response (the dense green region of the plot). B. The atypical SCE and LCD responses of ONH models with all typical ONH characteristics is shown. To ease visualization of isolated points we did not vary point intensity. To avoid plot saturation we therefore did not plot the cases with typical responses, which caused the white region in the center. Although it is seen that the responses of most ONHs do cluster near the threshold, there are several ONHs located very far from the typical response (circled in red).

