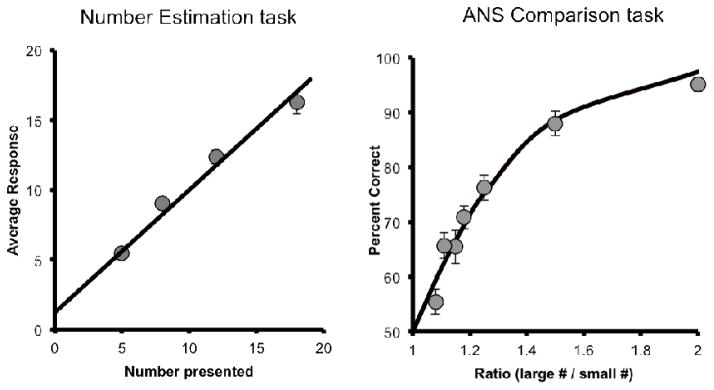
Figure 2.
Performance in the verbal Number Estimation task (left) and non-symbolic ANS Comparison task (right). Error bars in the Number Estimation graph depict standard errors of the mean and show an expected linear increase in the number word produced as the number of target dots increased. The best fitting linear function had a slope of 0.9 and an intercept of 1.22. Error bars in the ANS Comparison task graph depict standard errors of the mean and the line reflects the best fitting psychophysical model with w = 0.25.

