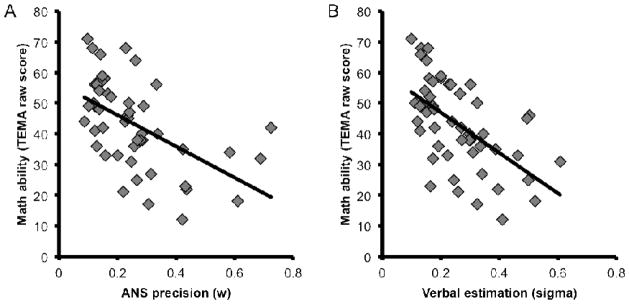
Figure 4.
Scatterplots depicting the relation between overall math ability (TEMA-3 raw scores) and ANS precision (A) and verbal number estimation (B). Children with greater ANS precision (i.e., lower w) or lower verbal estimation variability (i.e., lower sigma) tended to have greater overall math ability.

