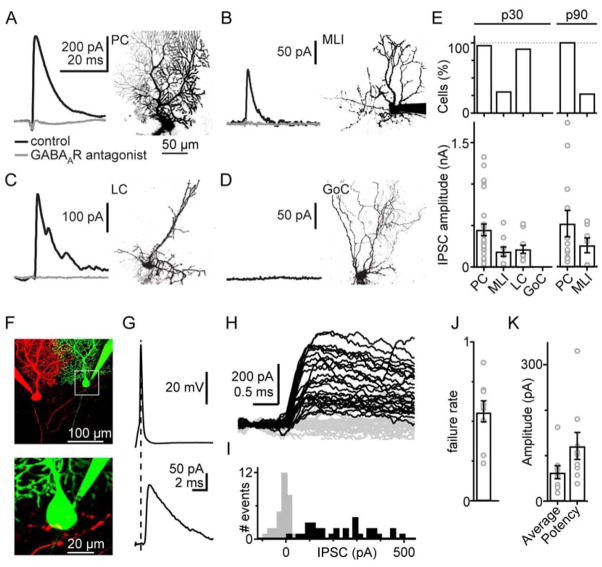
Figure 4. Functional identification of the synaptic targets of Purkinje cell collaterals.
A–D. Example recordings and cell identification using two-photon imaging. Responses were evoked with a brief pulse of light in the grC layer. Experiments for p30 mice are shown for: A. Purkinje cells, B. molecular layer interneurons, C. Lugaro cells, and D. Golgi cells.
E. Summary of the fraction of cells with optically evoked IPSCs (top), and IPSC size (bottom) in each cell type both for juvenile (p30) and for adult animals (p90).
F. Example of a connected PC pair (top). The presynaptic neuron was loaded with Alexa 594 (red), and the postsynaptic neuron with Alexa 488 (green). Magnified image (bottom) shows red boutons in close proximity to the green PC body.
G. Example average response from one pair. Presynaptic spike (top), postsynaptic current (bottom).
H. Example successes (black) and failures (grey).
I. Amplitude histogram of postsynaptic currents. Successes are shown in black, failures in grey.
J–K. Summary of failure rate, average synaptic current and potency of the nine connected pairs

