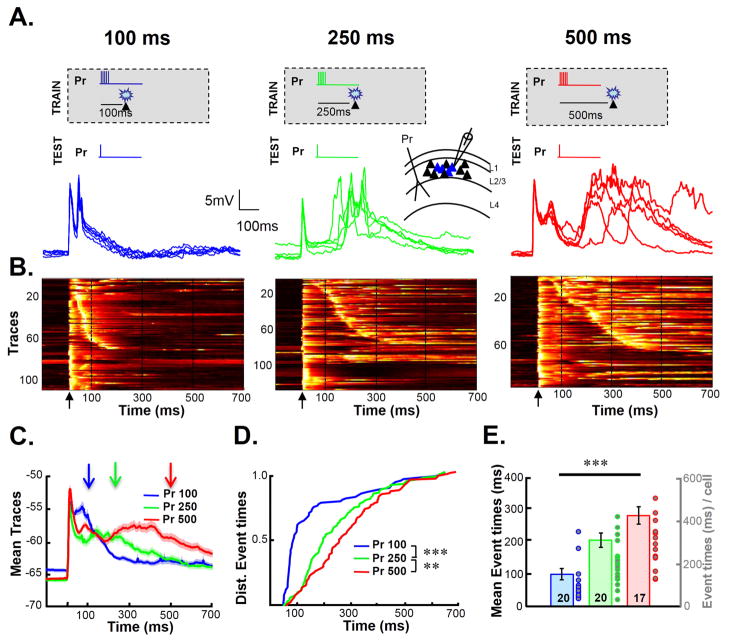
Figure 1. The temporal profile of network activity is dependent on training interval.
(A) Slices were trained for 4 hours by pairing electrical stimulation of the paired (Pr) pathway followed and optical stimulation, at an interval of either 100 ms (top left panel), 250 ms (middle), or 500 ms (right). Inset: Schematic of implanted electrodes and recording site. Five traces from a cell in each group in response to the Pr pathway after training (bottom panels).
(B) Raw data across all cells and trials (5 traces from each cell) from the 100 (left panel), 250 (middle panel), and 500 ms (right panel) groups. Voltagegram traces are normalized to their own peak and sorted according to latency of the first polysynaptic peak (i.e, the first peak after the initial response) if present. Voltage is represented on a color scale where black is the minimum and white the maximum. Arrows represent the time of the test stimulus, and dashed lines are presented to provide a better comparison of the timing across different panels.
(C) Mean ± s.e.m. (shading) of all traces (that exhibited polysynaptic activity) from the three training-interval groups. Arrows indicate the time of light delivery during training. Note that the timing of the polysynaptic peak in each waveform increases with the training interval.
(D) Cumulative distributions of polysynaptic event times.
(E) The group means of median polysynaptic event times of each cell.

