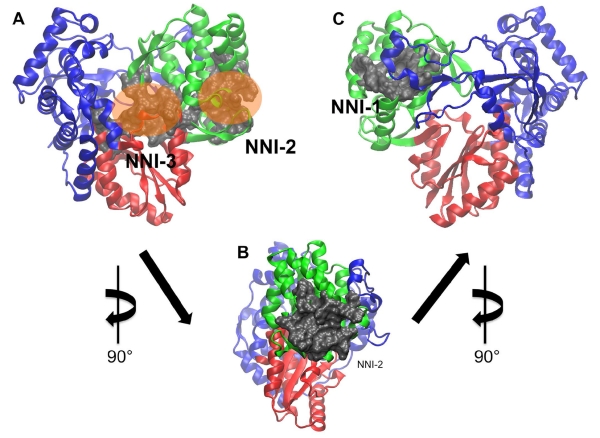
Figure 1.
Allosteric sites in the HCV polymerase used to evaluate the LBSPs. Protein residues are shown in ribbon representation while residues lining the binding pockets are shown in grey surface representation. Panel A shows a frontal view of the NNI-2 and NNI-3 sites, which are differentiated by the positions of orange translucent spheres. Panel B is a magnified lateral view of the NNI-2 site rotated 90° about the y-axis. Panel C is a rear view of the protein depicting the NNI-1 pocket after an additional 90° rotation about the y-axis. The thumb, palm and fingers domains are shown in green, red and blue respectively.

