
Figure 6.
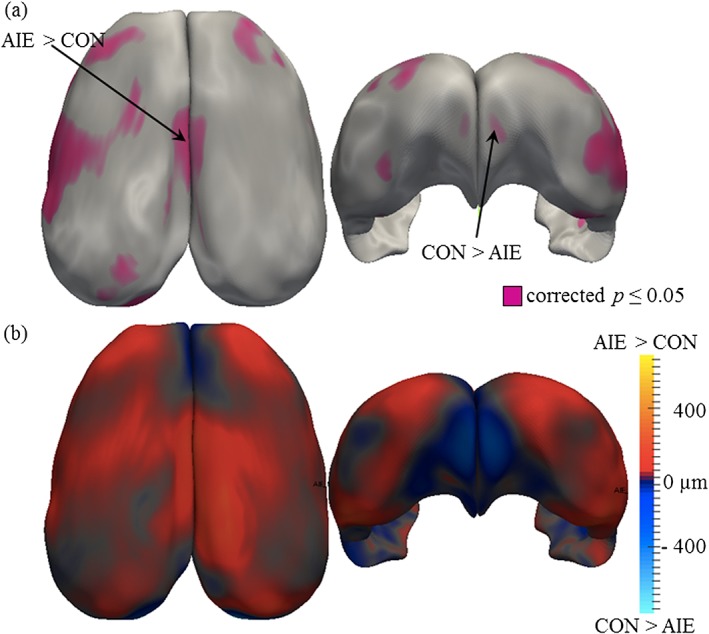
Results of the cortical thickness analysis in the adolescent intermittent ethanol (AIE) study. (a) Significance probabilities of paired Student's t‐test are mapped on the surface of the average 3D cortex with purple color for highly significant regions (p < 0.05) and gray for low. All p values are false discovery rate corrected with a 10 percent threshold. (b) The direction of mean thickness differences between the AIE and CON groups is depicted with red shades indicating regions where the AIE cortex is thicker and blue shades indicating regions where the CON group is thicker. Mean thickness differences are color‐mapped on the average cortex 3D surface with 25 002 corresponding points. Measurements range from −800 to +800 µm. Adolescent intermittent ethanol treatment caused thinning of the prefrontal cortex but thickening in the cingulate and retrosplenial cortices