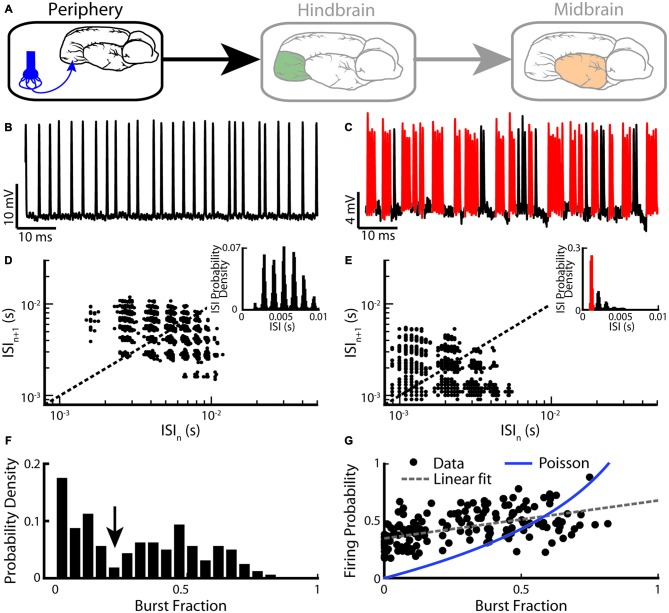
Figure 2.
Electrosensory afferents (EAs) are composed of two sub-populations: bursting and non-bursting. (A) Primary afferents from peripheral electroreceptors project onto pyramidal neurons within the hindbrain. (B) Example recording of a non-bursting EA. (C) Example recording from an EA that displays burst firing (red). (D) Return map of the same neuron shown in (B). Inset: interspike interval (ISI) distribution. (E) Return map of the same neuron shown in (C). Inset: ISI distribution. (F) Segregating a population (n = 94) based on burst fraction (i.e., fraction of ISIs below a threshold corresponding to the inverse of the EOD frequency indicated by the arrow ~2 ms) reveals two subpopulations of EAs (Two-sample Kolmogorov-Smirnov test, p ≪ 10–3). (G) Plotting firing probability as a function of burst fraction yields a positive correlation (r = 0.74). Also shown is the firing probability as a function of burst fraction for an equivalent Poisson process (blue curve). The data plotted in (B–G) are from Metzen and Chacron (2015).

