
Figure 6.
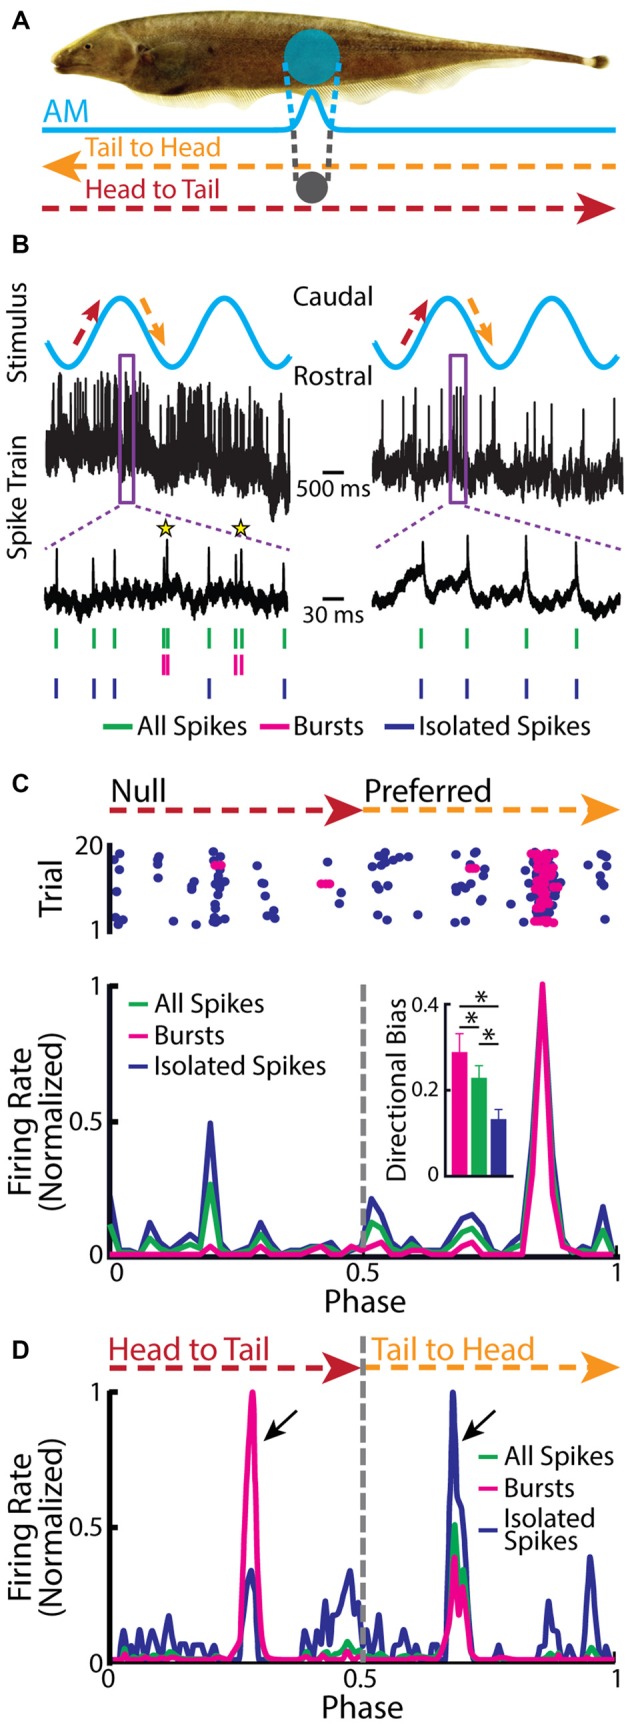
Neurons in the midbrain TS respond to a moving object. (A) Schematic showing the stimulation protocol. The gray sphere represents the moving object that was moved sinusoidally back and forth along the fish at a distance of about 1 cm lateral to the fish. The orange arrow indicates the tail-to-head direction, whereas the red arrow indicates the head-to-tail direction. The resulting local EOD AM and the spread of the electric image projected onto the skin are shown in blue. (B) Example in vivo recordings from a bursting TS (left) and a non-bursting TS neuron (right) to a moving object. Action potentials (green ticks) with ISIs that were shorter than the burst threshold were identified as belonging to bursts (magenta ticks), whereas those that were not were identified as isolated spikes (blue ticks). Burst events are indicated as yellow stars. (C) Raster plot from an example directionally selective bursting TS neuron. The spikes that belong to bursts are shown in magenta, whereas isolated spikes are shown in blue. Bottom: normalized PSTH for this same neuron computed from all spikes (both bursts and isolated spikes, green line), bursts (magenta line), and isolated spikes (blue line). Inset: population-averaged directional biases obtained for bursts (magenta), all spikes (green), and isolated spikes (blue). Asterisks indicate statistical significance at the p = 0.05 level using a signed-rank test. (D) Normalized PSTH for an example neuron where bursts and isolated spikes code for opposite directions of movement (arrows) computed from all spikes (green line), bursts (magenta line), and isolated spikes (blue line). The curves have been normalized by their maximum values. Directional bias values were 0.6, 0.5, and −0.63 for burst, all spikes, and isolated spikes, respectively. Data plotted in (B–D) are from Chacron et al. (2009), Chacron and Fortune (2010), Khosravi-Hashemi et al. (2011), Khosravi-Hashemi and Chacron (2012).