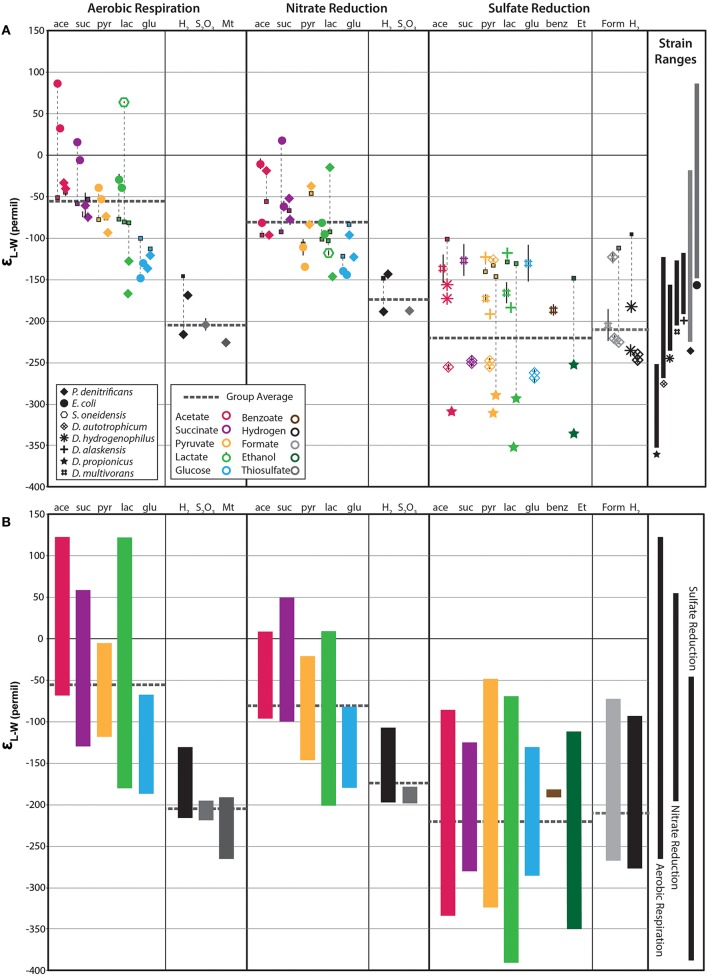
Figure 1.
Fractionations between fatty acids and water (εL−W) for all non-labeled experiments. (A) Individual symbols represent the abundance-weighted average εL−W for all fatty acids measured in a given culture experiment. Bulk biomass δ2H-values are shown as small squares with thin vertical dashed lines extending to the corresponding εL−W-value. Thick, horizontal, dark gray, dashed lines indicate the group average (e.g., heterotrophic aerobic respiration). The range of abundance-weighted average εL−W for each strain is shown on the far right. (B) Vertical colored bars indicate the total compound-specific range for each substrate condition. Compound-specific data is plotted in Figure S1. Black bars on the far right illustrate the total range of compound specific data for aerobic respiration, nitrate reduction, and sulfate reduction, respectively.

