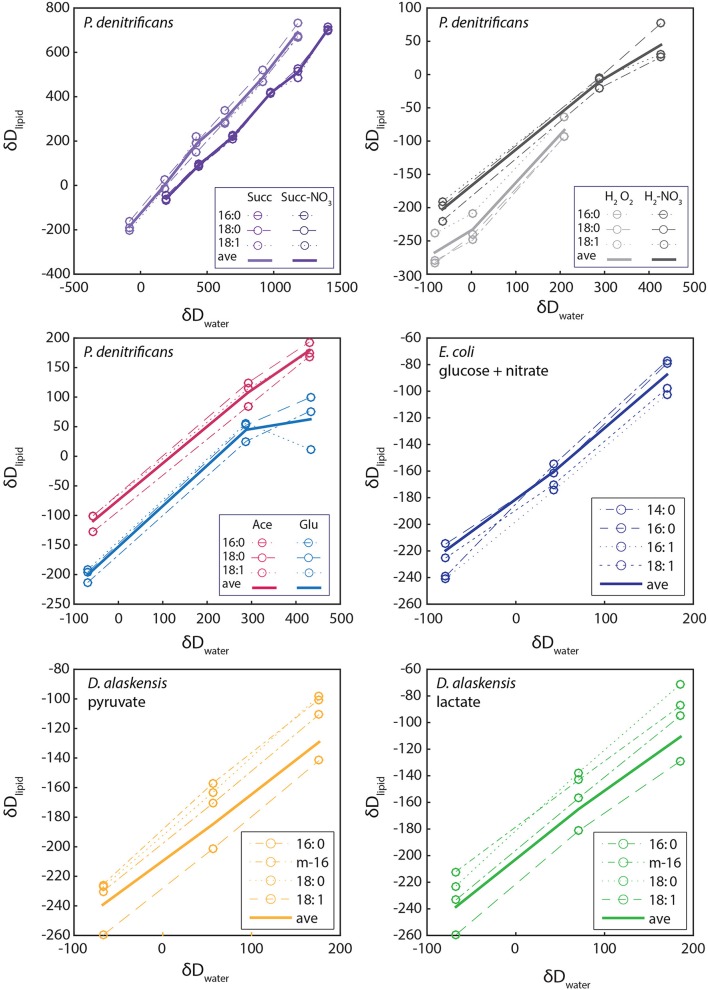
Figure 5.
The relationship between hydrogen isotopic composition of growth water and lipids for P. denitrificans, E. coli, and D. alaskensis. Linear regressions (not shown) were performed on the points for weighted average lipid values (bold lines), rather than data for individual lipids (dotted and dashed lines, see legend).

