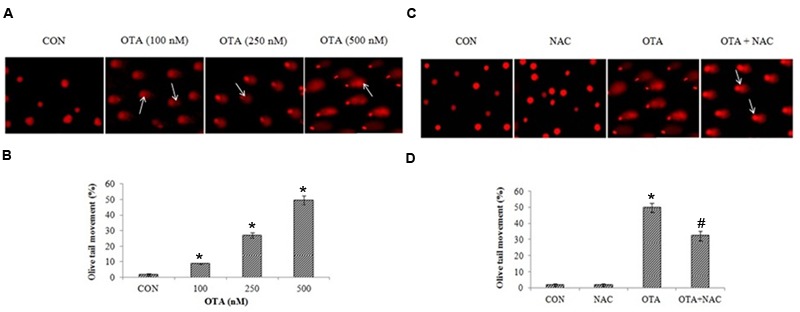
FIGURE 6.

OTA treatment induced DNA double strand breaks in Neuro-2a cells. (A) The photomicrographs represent the levels of DNA damage in Neuro-2a cells followed by without or with different concentrations of OTA treatment. (B) The tail lengths of the comet was measured in each cell using Comet assay IV software and represented as percent olive tail moment. (C) Neuro-2a cells were pretreated with NAC (1 mM) for 24 h followed by OTA (500 nM) treatment for 24 h and DNA damage was monitored and photographed (D) Tail lengths of the comet was measured by using Image pro® plus software.
