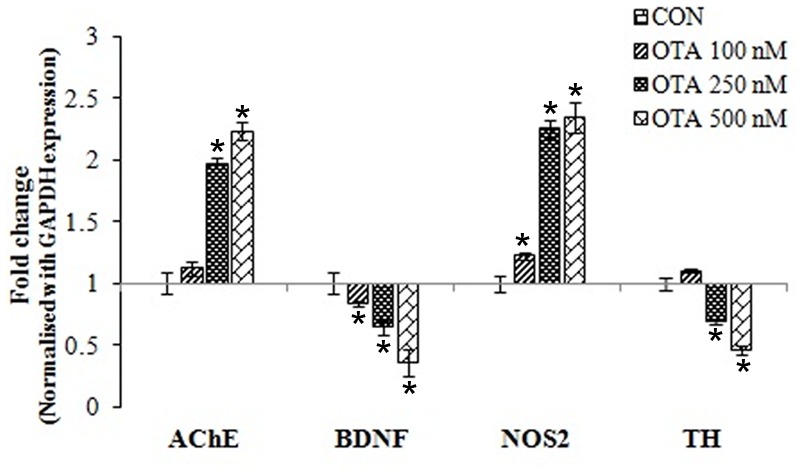
FIGURE 8.

Gene-expression profiles for neuronal biomarkers (AChE, BDNF, NOS2 and TH) were analyzed in Neuro-2a cells treated without or with various concentrations of OTA (100–500 nM) for 24 h using quantitative real time PCR. The fold change was calculated based on normalization with GAPDH gene expression. The data represented as mean ± SEM of three independent experiments. ∗p < 0.05 versus respective control group.
