
FIGURE 9.
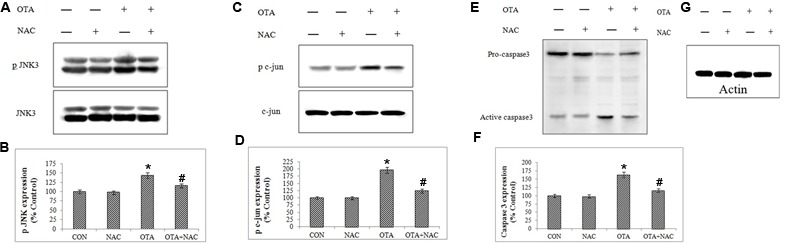
Protein-expression profiles for apoptotic biomarkers (JNK3, c-jun and caspase3) were analyzed in Neuro-2a cells by immunoblotting (A,C,E,G). The band intensity is calculated by Image-J software (B,D,F). The data represented as mean ± SEM of three independent experiments. ∗p < 0.05 versus respective control group and #p < 0.05 versus respective OTA treated group.