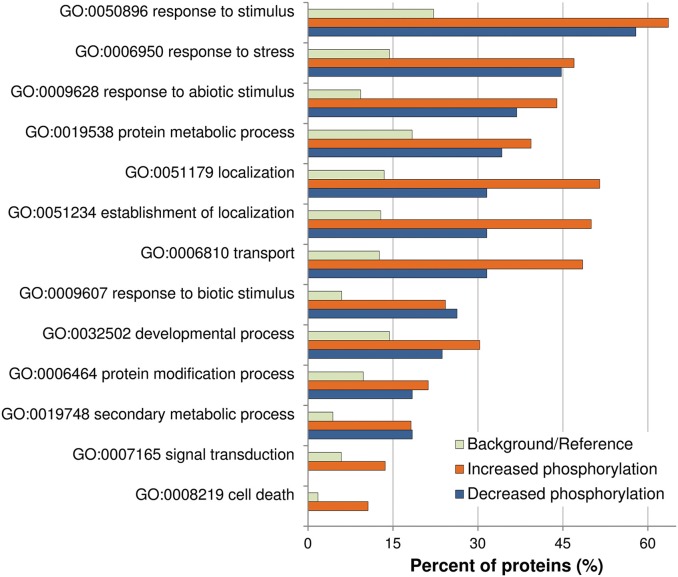
Figure 3.
Analysis of enriched GO term distributions within the differentially phosphorylated proteins. The analysis was performed on the differentially phosphorylated proteins listed in Table 1 (LC-MS/MS) and Table 2 (Phospho-DIGE) using the GO annotations of biological process in the AgriGO database (Y axis). Barplot shows selected GO terms significantly enriched (FDR < 0.05, Yekutieli adjusted) for proteins with increased or decreased phosphorylation. The background/reference represents the proportion of all annotated genes of each GO term within the total genes in the TAIR10 database.

