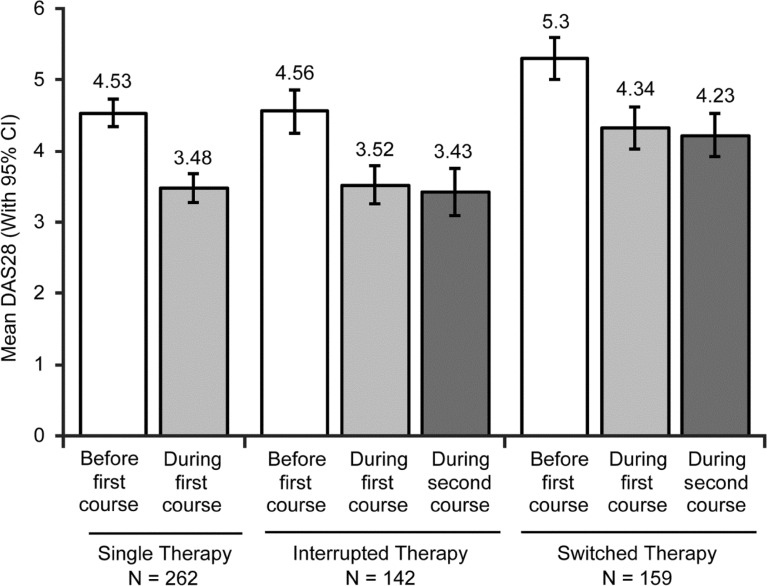
Fig. 2.
DAS28 before and during the first and second courses of treatment. Mean DAS28 values before the first course of treatment (open bars), mean values during therapy 90 or more days after the first course of treatment (light gray), and mean values during therapy 90 or more days after the initiation of the second course of treatment (dark gray) in patients receiving single therapy (left bars), interrupted therapy with the same TNFi agent (center bars), or switched therapy with a second TNFi agent (right bars) are shown. Error bars represent 95% CI. DAS28, Disease Activity Score based on 28 joints; TNFi tumor necrosis factor inhibitor, CI confidence interval

