
Fig. 2.
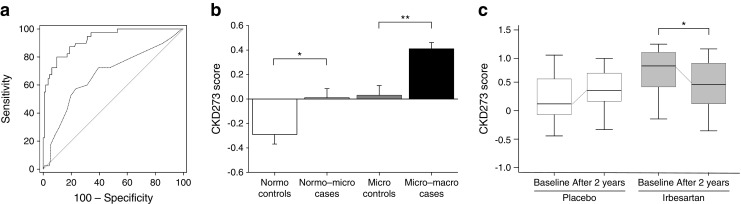
Overview of the CKD273 score for baseline risk prediction and drug response prediction. (a) Predictive ability of the CKD273 score in patients with diabetes and normoalbuminuria (n = 35 with 150 urine samples) at the time of urine sample collection up to 5 years prior to onset of diabetic nephropathy. The solid line shows the receiver operating characteristic (ROC) curve of the CKD273 score and the dashed line the ROC curve of the urinary albumin excretion rate (UAER) (p < 0.001 for difference in ROC curve between CKD273 score and UAER). Figure adapted from Zürbig et al [61]. (b) CKD273 score in patients with type 2 diabetes and normoalbuminuria (n = 48) or microalbuminuria (n = 40) at baseline. Patients transitioned during the albuminuria stage, whereas controls did not transition during follow-up. *p < 0.05, **p < 0.01 cases vs controls. White box, controls with normoalbuminuria; light grey box, patients with normo- to microalbuminuria; dark grey box, controls with microalbuminuria; black box, patients with micro- to macroalbuminuria. Figure adapted with permission from Roscioni et al [62]. (c) Box-and-whisker plots of the CKD273 score of patients from a nested case–control study in the IRMA-2 trial (n = 22) before (visit 2) and after 2 years (visit 9) of treatment with placebo (white boxes) or 300 mg irbesartan (grey boxes). *p < 0.05 baseline vs after 2 years. Figure adapted from Andersen et al [88]