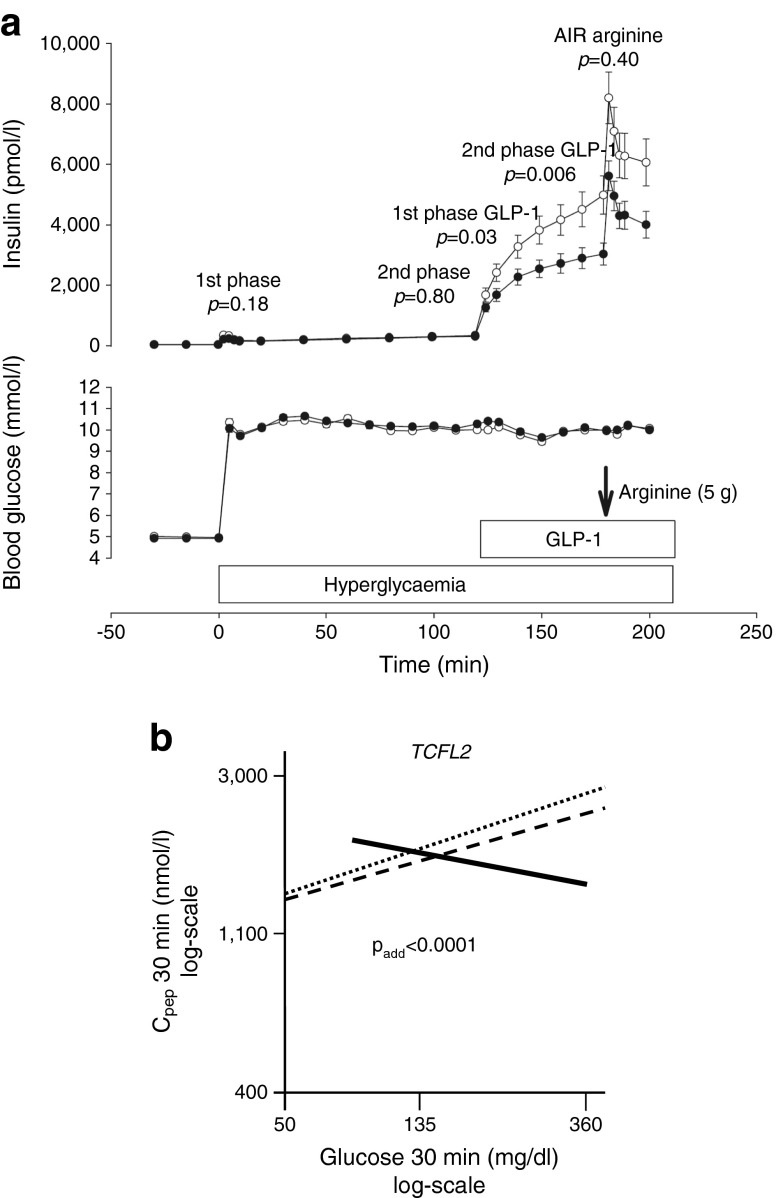
Fig. 2.
(a) Associations between the genotypes of rs7903146 polymorphism in TCF7L2 with insulin secretion during a hyperglycaemic clamp in 73 German individuals. White circles, CC; black circles, CT and TT. AIR, acute insulin response. The p values are for comparison between the genotypes for the first and second phases of glucose-induced insulin secretion, first and second phases of GLP-1-induced insulin secretion and acute insulin secretory response to arginine; figure reproduced with permission from [20]. (b) Association between C-peptide levels at 30 min of the OGTT and glucose levels at 30 min during the OGTT by TCF7L2 SNP rs7903146. Regression lines are shown. Dotted line, CC; dashed line, CT; solid line TT genotype of TCF7L2 SNP rs7903146; figure reproduced with permission from [23]. To convert glucose values from from mg/dl to mmol/l, please multiply by 0.0555

