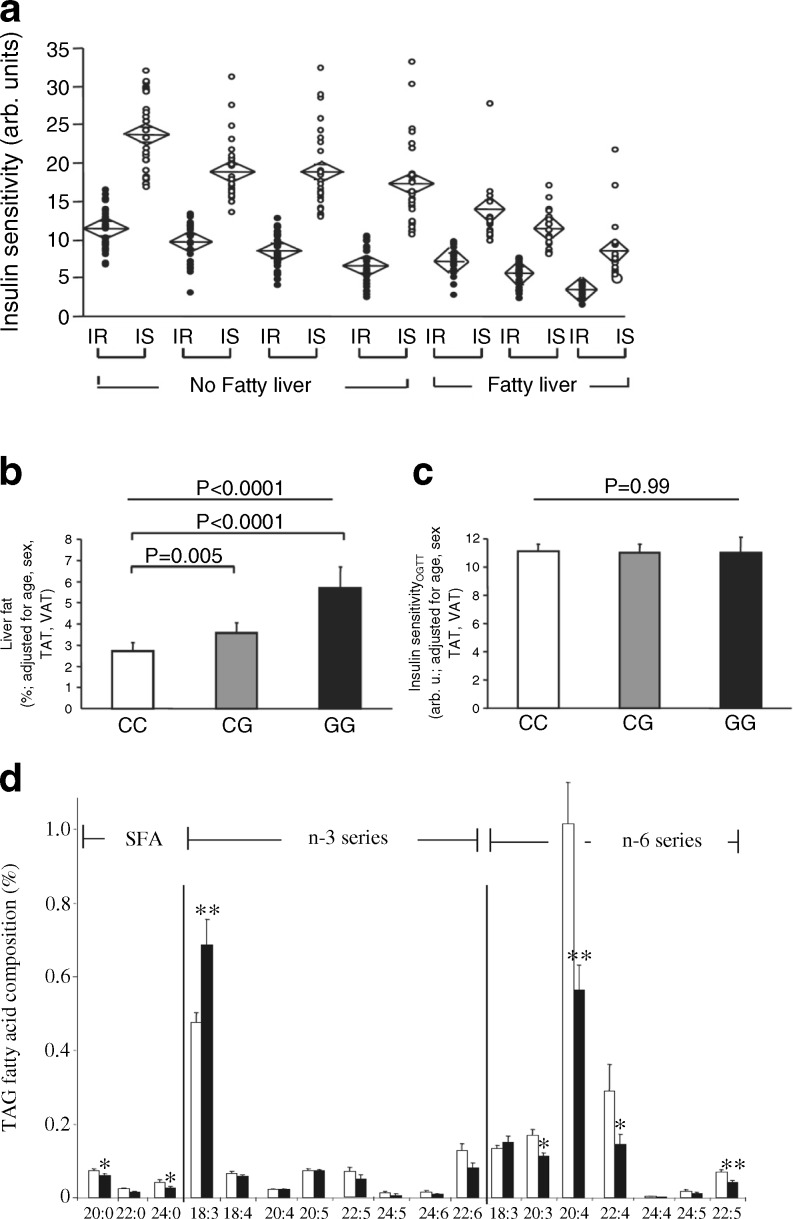
Fig. 4.
(a) Association of insulin resistance with the amount of liver fat. Individuals were divided into seven groups: quartiles of liver fat in individuals without fatty liver (liver fat <5.56%, n=225) and tertiles of liver fat in individuals with fatty liver (liver fat ≥5.56%, n = 112). Each group was then divided by the median insulin sensitivity into an insulin-sensitive (IS, white circles) and an insulin-resistant (IR, black circles) subgroup. Diamonds indicate mean and the 95% CI. Within each of the seven groups, the subgroups did not differ in liver fat. However, insulin sensitivity was lower in each group; figure reproduced with permission from [58]. (b, c) Liver fat content (b) and insulin sensitivity (c) associated with the I148M variant of PNPLA3,; figure reproduced with permission from [60]. (d) Fatty-acid profiles of hepatic triacylglycerol stores are dependent on the I148M variant of PNPLA3. White bars, wild-type individuals; black bars, PNPLA3 I148M individuals; figure reproduced with permission from [61]. TAG, triacylglycerol; TAT, total adipose tissue; VAT, visceral adipose tissue

